

Alginate-like polymers from full-scale aerobic granular sludge: content, recovery, characterization, and application for cadmium adsorption
Optimization of ALP recovery from AGS
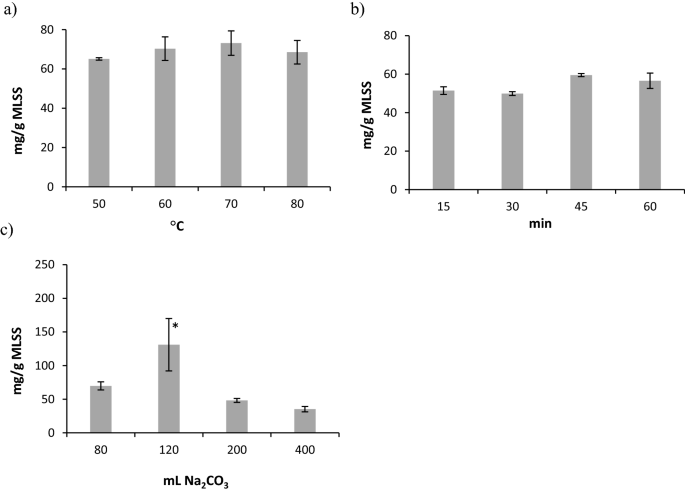
The yield of ALP-AGS was highest with an extraction temperature of 70 °C (Fig. 2a), an extraction time of 45 min (Fig. 2b), and 120 mL of 0.2 M Na2CO3/2.5 g MLSS (131 mg/g MLSS; significant differences, ANOVA, Tukey’s HSD test, p = 0.05) (Fig. 2c). This time was shorter and the temperature of extraction was lower than in the original methodology presented by Lin et al.17, which creates some opportunities for decreasing the costs of ALP recovery from AGS in full-scale installations.
Figure 2
Yields of ALP-AGS (expressed as mg TS ALP/g MLSS) at different extraction conditions: (a) temperature, (b) time, (c) volume of Na2CO3; n = 2; *—significant difference compared to other volumes of Na2CO3 (ANOVA, Tukey’s HSD test, p = 0.05).
Seasonal and intra-cycle changes in ALP content in AGS
The concentration of ALP-AGS was investigated for over 3100 cycles of stable performance in two independently operated full-scale GSBRs at a municipal WWTP. In this period, no serious operational problems were reported, and wastewater composition did not vary significantly. Both GSBRs were operated at similar biomass concentrations, which caused the main operational parameters of the GSBRs, such as the organic loading rate, to be nearly identical. At the respective beginnings of spring 2018 and spring 2019, the ALP-AGS content reached nearly 100 mg/g MLSS and over 150 mg/g MLSS (Fig. 3a). These values were slightly higher than the ALP-AGS content reported in another study conducted in a full-scale WWTP30 and similar to values observed in lab-scale reactors, which are usually higher than in full-scale systems23. For example, in lab-scale reactors fed with primary effluent from municipal wastewater, AGS contained 184 ± 18 mg VS ALP/g VSS9.
Figure 3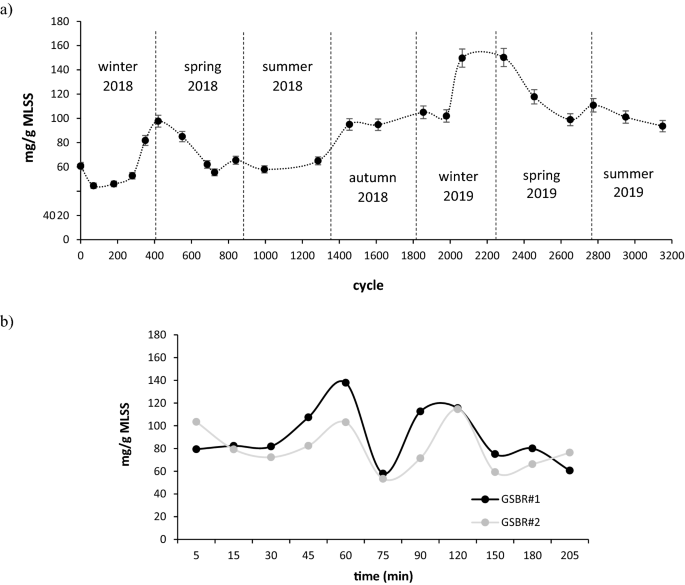
Variations in ALP content in AGS; (a) seasonal (n = 2, two independently operated full-scale GSBRs), (b) intra-cycle (measurement performed in two independently operated full-scale GSBRs during the aeration phase of the cycle 916).
In this study, the ALP-AGS concentration in sludge increased significantly in the transition periods between winter and spring. During these periods, the temperature dropped to 9 °C and was the lowest of the entire experimental period (Fig. S1, Supplementary Materials). Bacteria may produce EPS as a strategy for survival in cold environments, as the presence of EPS significantly reduces cell lysis31. In pure strains of Lactobacillus paracasei, low temperatures increased the content of the high molecular weight fraction of EPS and the total amount of EPS produced32. Our results indicate that low temperatures also affect the ALP content in AGS—the highest yields of this biopolymer from waste sludge at the WWTP can be recovered at the end of winter. The average concentrations of ALP in biomass were higher in 2019 than in 2018; this may be explained by gradual granule maturation, which favors biopolymer production33,34. In a study by Huang et al.35, ALP were only found in mature granules.
Variations in the amounts and characteristics of ALP (mostly the molecular weight, MW) during the operational cycle of industrial-scale batch reactors have been reported36. In the present study, the amount of ALP varied considerably during the cycle, from about 50 to over 120 mg ALP/g MLSS, and two peaks of ALP content in biomass were observed, 1 and 2 h from the beginning of aeration (Fig. 3b).
ALP production has been reported to follow almost the same trend as bacterial growth37. Similarly, in the present study, the peak activity of bacteria, as indicated by the 16S rRNA levels in cells (results not shown), overlapped with the peaks of ALP production. During the introduction of wastewater to the reactors, the dissolved oxygen concentrations in the bulk liquid dropped significantly to below 0.5 mg/L in the GSBRs. Such low oxygen concentrations in the environment stimulate anoxic and anaerobic metabolism in the middle and core granule layers38. Therefore, the first peak in ALP formation may have resulted from anaerobic bacteria, such as phosphate-accumulating and glycogen–accumulating microorganisms, intensively producing ALP after the start of aeration15. As alginate contains glucuronic acid, it can act as a barrier to oxygen diffusion, limiting its transfer to the enzyme complexes in bacterial cells and protecting the metabolic activity of strict anaerobes39.
In the present study, ALP production started to increase in the 75th minute of the GSBR cycle and peaked at 2 h, which can be explained by an increase in ALP biosynthesis after the depletion of easily biodegradable acetate present in the wastewater introduced to the GSBR (data not shown). This explanation is consistent with a report of reduced ALP production in bacterial cells after the addition of sodium acetate to pure cultures of Azotobacter vinelandi cultivated on glucose-based media40. A similar pattern of ALP production has been reported in lab-scale reactors operated with an anaerobic/oxic/anoxic cycle and fed with wastewater containing sodium acetate15. In that study, ALP content was highest after 90 min of aeration. In the present study, the reduction in ALP levels in AGS at the end of the GSBR cycle can be explained by ALP lyase activity, which degrades ALP in the post-polymerization step41. This reduction in ALP levels is consistent with reports of batch tests, in which ALP production and its molecular weight dropped over time42,43. Practically speaking, our results indicate that, in a full-scale operation aimed at ALP recovery, the sludge must be discharged about 2 h after the start of aeration.
Adsorbent characteristics
ALP-AGS and ALG had a low surface area (Table 1). The pore volume of ALP-AGS was about 24 times larger than that of ALG, but both adsorbents had similar pore diameters, the size of which indicated that they had microporous structures44. The surface area of ALG can vary considerably, depending on ALG conditions (e.g., the sodium alginate concentration, the type and concentration of gelation agent, etc.) or ALG modification. ALP-AGS that was produced with much more concentrated CaCl2 (12.5%) than that in the present study had a much larger surface area (76.2 m2/g) and a slightly larger pore volume (0.0623 cm3/g), but the pores had a smaller diameter (0.0177 nm)25. Aziz et al.45 have shown that the surface area of pristine ALG was low (4.1 m2/g), but that it increased 76 times (on average) after ALG modification with natural clay, natural phosphate, or activated charcoal. Because the aim of our preliminary study was to compare the usability of waste ALP with commercial ALG for metal removal, both adsorbents were used without any modification.
Table 1 Basic characteristics of the adsorbents (mean ± SD, n = 3).
Structural morphology
SEM images of the surface of ALG and ALP-AGS (Fig. 4) showed that both adsorbents had a very dense appearance without much porosity, which can indicate strong cross-linking caused by Ca2+ ions during the reaction with CaCl246. Similarly, Torres-Caban et al.47 used SEM analysis to find that calcium alginate beads had a smooth surface without much porosity. At higher magnifications, the surface of the ALP-AGS was less regular and contained structures resembling crystalline outgrowths. An irregular and rough surface might indicate strong cross-links with Ca2+34 and can be also attributed to water evaporation and surface shrinking48.
Figure 4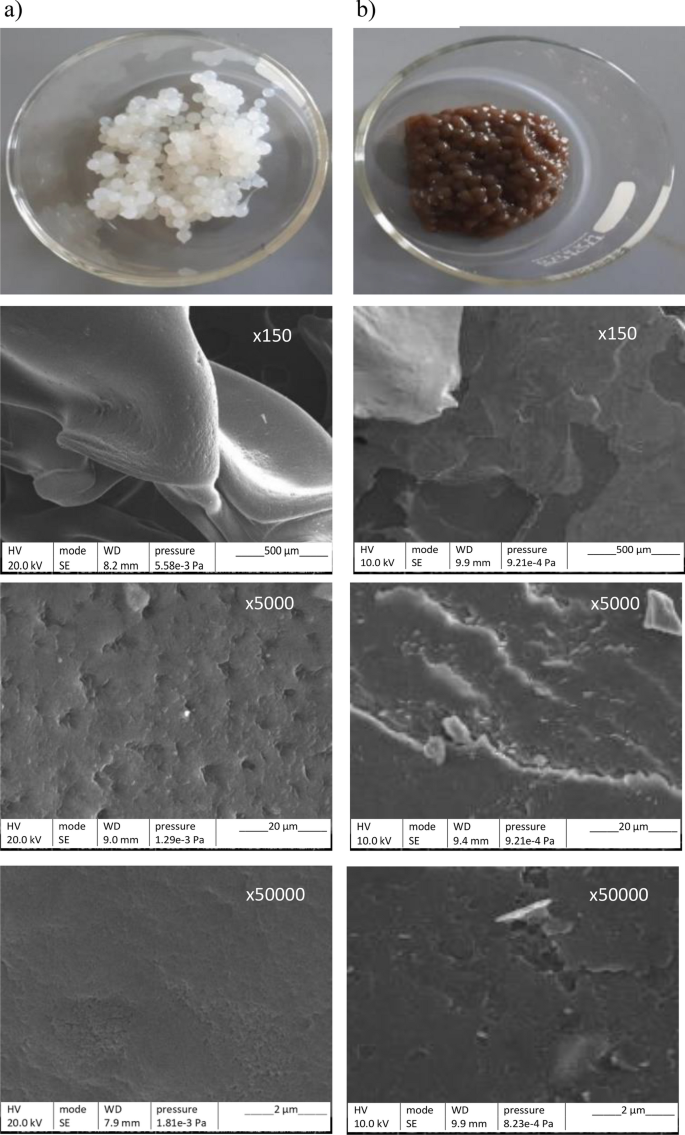
Adsorbent beads and their respective SEM micrographs at different magnifications (× 150, × 5000, × 50,000): (a) ALG, (b) ALP-AGS.
Elemental composition
SEM–EDX analysis revealed 9 elements on the ALG surface, and the major constituents (expressed in mass %) were C (11.03 ± 0.08), O (67.76 ± 4.20), Ca (12.53 ± 0.04), Na (3.95 ± 0.11), and Cl (2.97 ± 0.15) (Fig. S2). On the ALP-AGS surface, 12 elements were identified, with lower contents of C (5.48 ± 2.28), O (58.74 ± 1.70), and Na (0.96 ± 0.21) than ALG, and higher contents of Ca (13.04 ± 2.88), Al (1.87 ± 0.19), S (1.29 ± 0.25), P (4.04 ± 0.30), and Cl (6.31 ± 0.24). In contrast to ALG, ALP-AGS also contained N (7.47 ± 0.23) and trace amounts of Fe (0.16%) and Cu (0.30%). For comparison, Isik et al.49 showed that calcium ALG beads were composed of C (9 mass %), O (19 mass %), Na (6 mass %), Cl (34 mass %), and Ca (32 mass %). The presence of C and O may correspond to functional groups distributed on the surface of the adsorbents50. The presence of Cl in alginate sorbents is often due to incomplete washing of the adsorbent with water at the end of gelation with CaCl2. The presence of S and Al in ALG beads can be due to algae components or impurities associated with alginate extraction47. Finally, the nitrogen and phosphorous in the ALP-AGS indicate that these nutrients were transferred from AGS during ALP isolation.
Adsorption of Cd2+ onto ALG and ALP-AGS
Cd2+ adsorption onto the tested adsorbents was optimized in terms of adsorbent dosage, pH, initial Cd2+ concentration, and sorption time.
Adsorbent dosage
At the lowest adsorbent dosage (0.7 g d.m./L), the process efficiency was higher for ALG (91%) than for ALP-AGS (75%) (Fig. 5a). This may be connected with the lower number of active sites on ALP-AGS. As the dosage of ALP-AGS was increased from 0.7 to 7.9 g d.m./L, the efficiency increased from 75 to 93%, which can be attributed to the presence of a greater number of adsorbent sites at a higher adsorbent dosage50. With adsorbent dosages in the range of 7.9–15.9 g d.m./L, the average Cd2+ adsorption efficiency, at an initial metal concentration of 10 mg/L, was 94.3 ± 0.2% for ALG and 94.4 ± 0.9% for ALP-AGS. Based on the residual concentration of Cd2+ in the solution after adsorption and the Cd2+ removal efficiency, an ALP-AGS dosage of 7.9 g d.m./L was selected as optimum.
Figure 5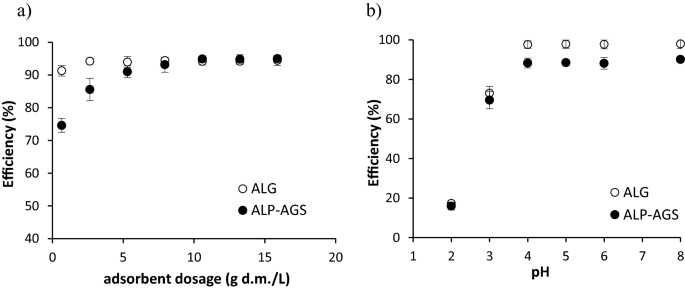
The efficiency of Cd2+ adsorption onto ALG and ALP-AGS depending on: (a) adsorbent dosage (10 mg Cd2+/L; pH 5.0; 2 h); and solution pH (10 mg Cd2+/L; 2 h; adsorbent dosage 2.6 g d.m./L); n = 2.
pH
The efficiency of Cd2+ removal by ALG and ALP-AGS depended on the solution pH (Fig. 5b). The pH is known to be important for controlling metal adsorption, as it affects both the chemical properties of surface functional groups and the speciation of metal ions51. The best sorption effects with both sorbents were obtained with pH values in the range of 4–8; at these values, the average adsorption efficiency was 88.7 ± 0.9% for ALP-AGS and 97.0 ± 0.2% for ALG. Adsorption efficiency and adsorption capacity were lowest at pH 2–3. Kuczajowska-Zadrożna et al.52 found that Cd2+ adsorption onto ALG beads reached 91% at pH values ranging from 5.0 to 9.0, and that reducing the pH to 2.0 significantly decreased the adsorption efficiency to 23%. Mahmood et al.53 reported that pH 6.0 was optimum for Cd2+ adsorption onto ALG.
Changes in the pH can affect the charge of functional groups on the surface of the adsorbent, which, in turn, affects its capacity to adsorb metals. ALG sorbents consist mainly of guluronic and mannuronic acid units containing carboxyl and hydroxyl groups54,55. The pKa values of the carboxyl groups of the mannuronic and guluronic acid units in ALG are 3.38 and 3.65, respectively54,55. Although the individual constituents of the ALP-AGS were not analyzed in the present study, EPS that was recovered from AGS contained mainly proteins (≈ 87%), polysaccharides (≈10%), and humic acids (2.3%)56. Proteins are the main source of carboxyl, hydroxyl, and amine groups, while polysaccharides and humic acids are the sources of hydroxyl groups56. Although the content of humic acids in the EPS from AGS was lower than that of proteins, humic acids are high in carboxylic acids and phenols, implying that they might be used as chelating agents. Humic acids and proteins can form complexes with cationic metals that are beneficial for metal adsorption57. The negative surface charge of EPS at a pH range of 3 to 10 is related to the deprotonation of carboxyl (pKa ≈ 3.0), phosphoryl (pKa ≈ 6.5), amine (pKa ≈ 8.4), and hydroxyl (pKa ≈ 10.2) groups56. In the EPS from the granular sludge, carboxyl and hydroxyl groups were most abundant and were mainly responsible for Pb2+, Cd2+, and Zn2+ adsorption56.
In the present study, all FTIR spectra (Fig. 6) contained absorption bands that indicated the presence of hydroxyl, ether, and carboxylic functional groups. From 3600 to 3000/cm, stretching vibrations of O–H bonds appeared, which are typical of polysaccharides46, and also N–H stretching vibrations of amino groups at ~ 3283/cm in the ALG-AGS spectra, which could confirm the presence of proteins27,58,59. At 2952–2852/cm in ALP-AGS spectra, stretching vibrations of aliphatic C–H were observed. These bands can be assigned to fatty acids60, and their intensity was greater in the ALP-AGS spectra than in the ALG spectra (Fig. 6b). An additional band at ~ 3087/cm in the ALP-AGS spectra indicates the presence of aromatic structures (also the band at ~ 1540/cm). The latter band may also have a contribution from the vibrations of amide II groups, i.e., N–H bending (also visible at 1515/cm) and C–N stretching in proteins60. The presence of C–N bonds is, in turn, confirmed by the band at 1378/cm58. The presence of hydrophobic components does not affect the adsorbent’s capacity for metal adsorption, but it can indirectly affect the location of polar hydrophilic groups responsible for metal adsorption47. The peaks at ~ 1730/cm are characteristic of C=O symmetric stretching in carboxylic acids. After Cd2+ adsorption, this band is no longer visible in the ALG spectrum (Fig. 6a), which may indicate that Cd2+ bonded with these acid groups. The bands at ~ 1590/cm (Fig. 6a) indicate the presence of ionic carboxylate salts.
Figure 6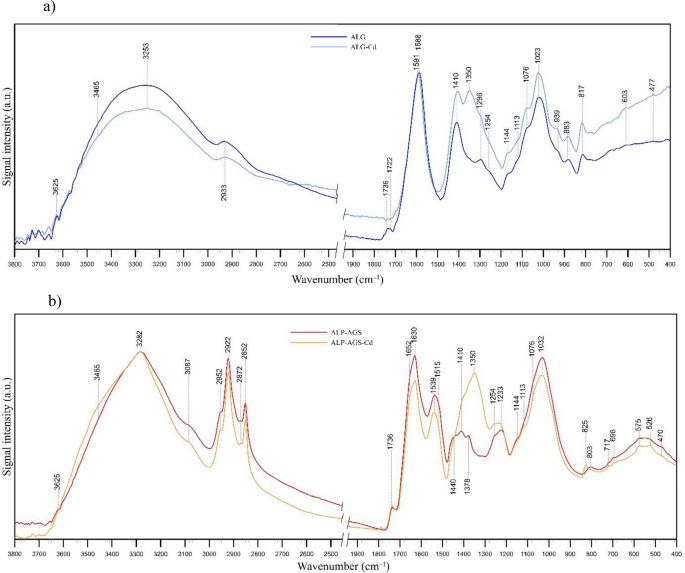
FTIR spectra of adsorbents before and after Cd2+ adsorption: (a) ALG, (b) ALP-AGS.
From 1652 to 1630/cm in the ALP-AGS spectra, bands are visible that correspond to amide C=O and C–N stretching, N–H bending, C=C stretching in proteins, hydroxyl O–H stretching of polysaccharides27,58,60, and/or COO– groups (Fig. 6b), which may indicate that these groups were more covalent in character. After Cd2+ adsorption, the intensity of these bands in the ALP-AGS spectra decreased (Fig. 6b), which may indicate the participation of carboxylate groups in the formation of complexes with Cd2+. The bands at 1100–1000/cm correspond to the glycosidic bonds in the polysaccharide (C–O–C stretching)56,61,62.
The presence of bands at ~ 1410/cm may result from the overlapping of C–H group vibrations and COO– group stretching61. This band can be assigned to the stretching vibration of C=O and the deformation vibration of –OH in carboxylate, alcohol, or phenol structures56,63, and its enhancement after adsorption is explained by the rearrangement of molecular bonds and therefore the formation of new bands. After Cd2+ adsorption, both the ALG and ALP-AGS spectra have additional bands at ~ 1350/cm, and the bands at ~ 1410/cm have higher intensity, which may indicate both complexation of Cd2+ and the presence of nitrates (the source of the Cd2+ in the aqueous solution).
Thus, the high efficiency of Cd2+ removal at pH values over 4.0 was related to metal complexation with negatively charged functional groups (especially COOH and OH groups) on the ALG and ALP-AGS surfaces according to these reactions: 2ALG-COO– + Cd2+ → (ALG-COO)2Cd2+ and 2ALP-AGS-COO– + Cd2+ → (ALP-AGS-COO)2Cd2+64. The presence of monovalent species of Cd, which is due to the pH, can promote its complexation65. At pH < 6.0, it is present mainly as Cd2+. At pH > 6.0, the Cd2+ content gradually decreases and other Cd-containing species appear, e.g., CdOH+, Cd2OH+3, and Cd(OH)2(s)51,66. Due to the amphiphilic character of EPS from AGS and the presence of abundant negatively-charged functional groups, metals can also be adsorbed via electrostatic attraction, ion exchange, or surface precipitation56,67.
Contact time and adsorption kinetics
The effect of contact time on Cd2+ adsorption onto ALG and ALP-AGS is shown in Fig. 7. The amount of Cd2+ adsorbed at a specific adsorption time (qt) indicates that, as the contact time was increased from 5 to 60 min, Cd2+ adsorption increased, and then between 60 and 180 min, the adsorption curve was flat. Similarly, Liu et al.56 observed very quick metal (Pb2+, Cd2+, Zn2+) adsorption onto EPS recovered from AGS cultivated in a lab-scale sequencing batch reactor. The metal adsorption sharply increased within the first 10 min, and progressively slowed until saturation after about 60 min. The fast adsorption onto EPS could be related to metal interactions with functional groups of proteins. The R2 and SSE values indicate that Cd2+ adsorption onto both types of adsorbents at different contact times was well described by a pseudo-second-order kinetics model (Fig. 7)54.
Figure 7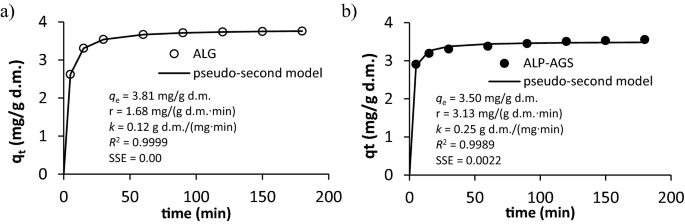
The effect on contact time on Cd2+ adsorption: (a) ALG, (b) ALP-AGS (10 mg Cd2+/L, pH 5.0; adsorbent dosage 2.6 g d.m./L). In the Figure, the values of parameters determined with pseudo-second kinetic order are included.
The good fit of the model to the data indicates that the rate-limiting step in Cd2+ adsorption is chemisorption, which in the case of ALG and ALP-AGS, was due to complexation and electrostatic attraction between Cd2+ and negatively charged groups, as well as ion exchange between Cd2+ and other cations on the adsorbents’ surfaces, e.g., Ca2+. During the initial stage of adsorption, Cd2+ removal was rapid, as shown by the initial rate of adsorption (r), which was higher for ALP-AGS than for ALG. As time elapsed, the adsorption process slowed, due to the saturation of the available surface-active sites. For both adsorbents, equilibrium conditions for Cd2+ removal were reached within 60 min (Fig. 7).
Initial Cd2+ concentration and adsorption isotherms
The effects of the initial Cd2+ concentration (5–200 mg/L) on the metal removal efficiency and the adsorption capacity of the ALG and ALP-AGS are shown in Fig. 8a–d respectively.
Figure 8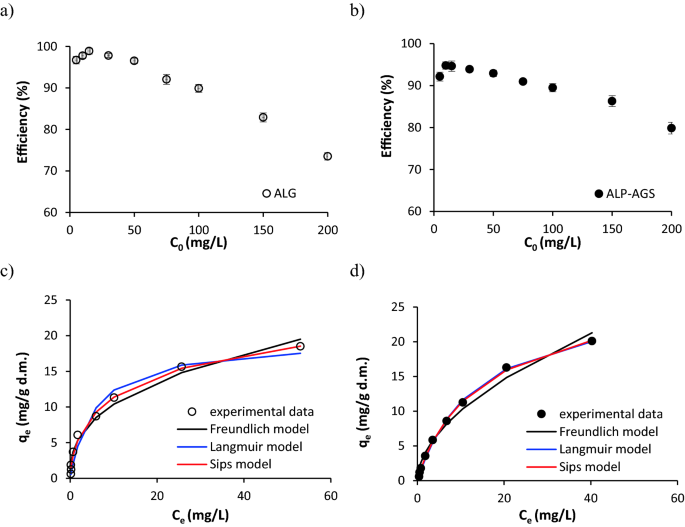
The efficiency of Cd2+ adsorption onto ALG and ALP-AGS depending on initial Cd2+ concentration (a, b) and isotherms of Cd2+ adsorption (c, d) (pH 5.0; 2 h; adsorbent dosage 7.9 g d.m./L) (n = 2). For ALP-AGS, the adsorption isotherm of the Langmuir model (blue line) coincides with the Sips model isotherm (red line).
The initial Cd2+ concentration affected the efficiency of adsorption with ALG and ALP-AGS. At initial Cd2+ concentrations in the range of 5–15 mg/L, the average Cd2+ removal efficiency slightly increased from 96.7 to 98.9% for ALG and from 92.1 to 94.6% for ALP-AGS. However, at initial concentrations above 15 mg/L, the efficiency gradually decreased to 73.5% (ALG) and 79.9% (ALP-AGS) (Fig. 8c, d). This means that the presence of available adsorption sites onto the adsorbents was high up to the relevant Cd2+ concentration.
The relationship between the amount of Cd2+ adsorbed by ALG and ALP-AGS and the concentration of Cd2+ remaining in the solution was evaluated with the Freundlich, Langmuir, and Sips models. Of these three adsorption models, the Sips model had the highest R2 values and the lowest SSE values (Table 2), indicating that it was the most suitable for describing Cd2+ adsorption onto tested adsorbents. The qmax is one of the principal criteria for the suitability of a particular adsorbent for metal removal. According to the Sips model, the qmax values were 29.3 mg/g d.m. for ALG and 29.5 mg/g d.m. for ALP-AGS. With comparable qmax, a lower value for energy of adsorption (b) was for ALP-AGS. With the Langmuir model, the qmax value for ALP-AGS was similar to this calculated from the Sips model. Thus, ALP-AGS has the potential to serve as a substitute for commercial ALG. These qmax values are similar to those reported from other studies of Cd2+ adsorption with ALG adsorbents, e.g., ALG–calcium carbonate beads: qmax, Langmuir = 10.2 mg/g53, qmax, Langmuir = 37.8–68.9 mg/g68, qmax, Langmuir = 38.05 mg/g and qmax, Sips = 38.65 mg/g47. Liu et al.56 found that EPS extracted from AGS exhibited a high adsorption capacity for Cd2+ (1470 mg/g) that was much higher than for ALP-AGS and conventional biosorbents. The differences in adsorption capacities can be related to the methods used for the biopolymers’ recovery from the sludge matrix and their purification, which can provide more efficient exposure to the negatively charged sites. In the present study, ALP recovered from AGS was not purified.
Table 2 Parameters of Cd2+ adsorption onto ALG and ALP-AGS determined with selected adsorption models.
The Sips model being a combination of Langmuir and Freundlich isotherm models allows for predicting the heterogeneous adsorption systems. This model adjusts to low and high concentrations of metal ions where the interactions of the metal with the adsorbent are different69. Based on the values of heterogeneity index (n), adsorption of Cd2+ by ALP-AGS seems to occur onto more uniform and homogenous active sites compared to ALG69. A degree of homogeneity/heterogeneity of the adsorption sites can depend on the number of functional groups with the same capacity for adsorption. Cd2+ with low bonding strength is mainly adsorbed by carboxyl groups in the ALG molecule. Due to the conformational changes in the saccharide chains of G and M blocks, all carboxyl groups are not easily available, which affects the adsorption process52. Within the egg-box structure of ALG, the G-block carboxyl groups are less readily available to the metal ions, whereas the M-block carboxyl groups can more easily interact with Cd2+70. In contrast to ALG, active sites on ALP-AGS, come not only from polysaccharides but also from proteins or humic acids71. The investigations of metal adsorption onto individual EPS components (proteins, humic acids, and polysaccharides) recovered from different sludges have demonstrated that proteins exhibited the highest adsorption capacity for Cd2+ removal, while the polysaccharides were less efficient71. Thus, it might suggest that some irregularities in active sites onto polysaccharides in ALP-AGS can be compensated by active sites from other polymers co-existing in ALP.
Chemical composition of alginate adsorbents after Cd2+ adsorption
SEM–EDX analysis of adsorbents after Cd2+ adsorption revealed that their composition had undergone some changes during the adsorption (Figs. 8, S2) process. Sorption of Cd2+ caused a decrease in the share of most elements analyzed with SEM–EDX, especially C (which may be related to changes in the carbon structure of alginate), as well as Ca (which may be related to the ion exchange mechanism of Cd2+ adsorption)72. Alkali metals play the role of ion exchange in the process of metal adsorption. Among them, Ca ions play an important role in the ion exchange of metal cations under medium acidic conditions73,74. In the present study, the experiment on Cd adsorption was performed at pH 5.0, and Ca release was observed from both ALG and ALP-AGS. Similarly, Ablough et al.75 found that after the adsorption of Pb on hybrid beads of chitosan and sodium alginate, the Pb peak appeared in the EDX spectra, while the Ca peak disappeared, indicating that Ca was completely removed from the adsorbent and ion exchange was the main mechanism of Pb adsorption. Bée et al.76 related the binding of Pb to Ca-alginate beads to the release of Ca and found that the amount of Ca remaining in the biopolymer bead was very small when the sorbent was saturated with Pb. Some divalent heavy metal ions with high reactivity can exchange Ca ions while maintaining the structure of the crosslinked adsorbent55 without unraveling the polymer.
The surface EDX mapping of the ALG and ALP-AGS proved the realization of the Cd2+ adsorption process, with comparable mass % of Cd2+ onto ALP-AGS (3.92 ± 1.25 mass %) and ALG surfaces (3.20 ± 0.43 mass %). These results correspond well with the maximum adsorption capacities estimated from Langmuir and Sips models (Table 2). The images obtained through mapping elements in SEM–EDX for Cd2+ exhibit uniform metal distribution on the surface of both adsorbents (Fig. 9).
Figure 9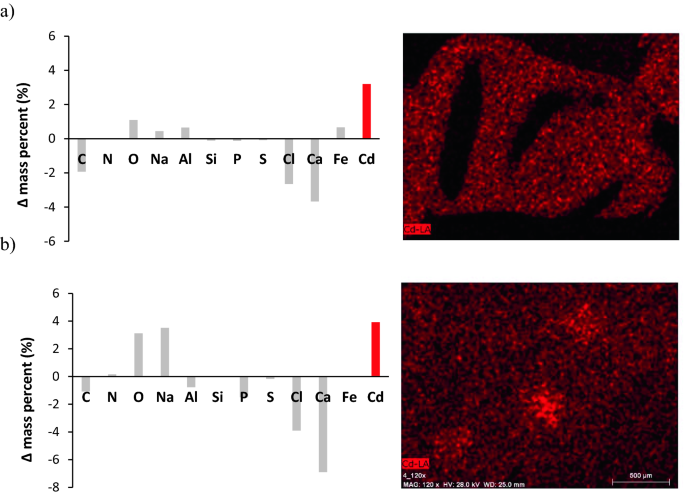
Changes in the chemical composition of ALG (a) and ALP-AGS (b). Δ mass percent indicates the difference in the content of an individual element before and after Cd2+ adsorption (a positive value = an increase of a given element, a negative value = a decrease of a given element). The images show the elemental mapping of Cd after adsorption on ALG and ALP-AGS surface (pH 5.0, adsorbent dosage 7.9 g d.m./L, 200 mg Cd2+/L, 2 h).
Comments are closed.