

Microfluidic assisted low-temperature and speedy synthesis of TiO2/ZnO/GOx with bio/photo active cites for amoxicillin degradation
Cross-sectional view of TiO2 coated microchannels
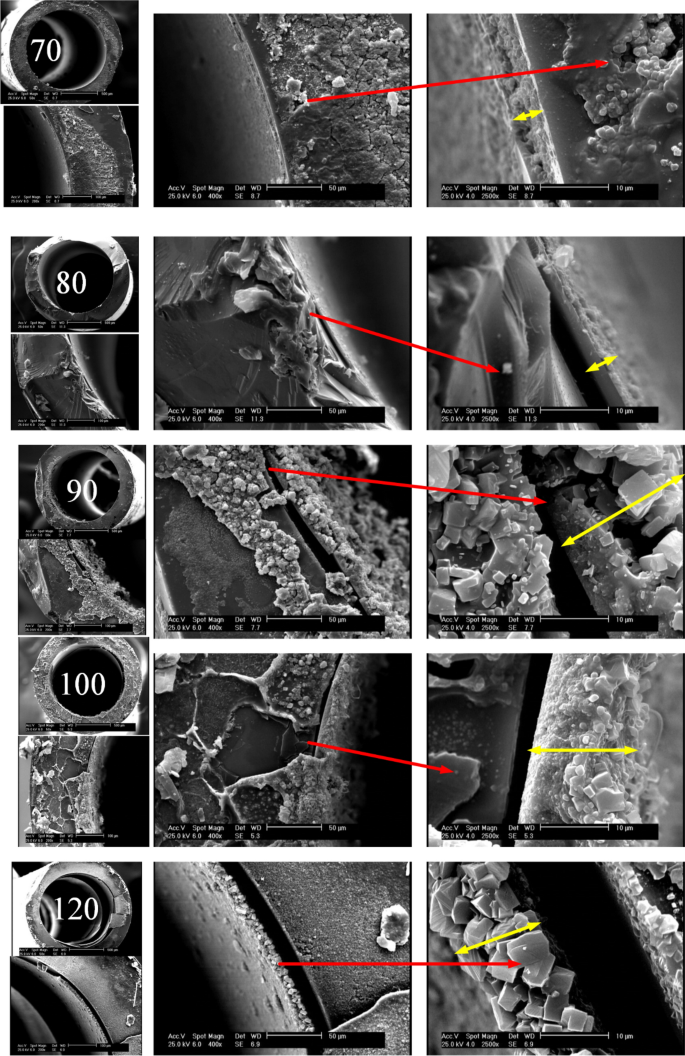
To observe how temperature influences the thickness of the synthesized TiO2 layer, SEM snapshots of capillaries cross-sections at different scales including 500, 100, 50 and 10 µm and various synthesis temperatures from 70 to 120 °C have been taken. The yellow arrows represent the thickness of the layer. According to Fig. 2, at 70 and 80 °C, the TiO2 layer is more uniform and the effect of temperature on the layer thickness is incremental. At 90 °C, particles of different sizes are formed, which causes the thickness of the layer to increase with a greater slope. At 100 °C, due to the initiation of more nucleation, more particles are formed with smaller sizes. At 120 °C, particles with more regular shapes and relatively close sizes are formed, which can be due to the balanced longitudinal and transverse growth of the TiO2 structure.
Figure 2
Cross-section SEM images of photo-catalysts grown within the inner wall of the capillaries at 70–120 °C.
TiO2 growth rate and histogram
According to Fig. 2 and with aid of image j software, the following histogram (Fig. 3a) is attained for TiO2 layer thickness, which shows the effect of temperature in the range of 70–120 °C is not inevitably ascending. In other words, from 70 to 90 °C, the layer thickness and its standard deviation increase. From 90 to 120 °C, the layer thickness decreases. At 90 °C, due to secondary nucleation, it is a turning point in microfluidic synthesis. Such behavior was observed in the bulk system at 180 °C. The ideal synthesis temperature can be 70 °C. First, TiO2 size is smaller, which is larger according to15 corresponding to the specific surface area. Second, size distribution is the narrowest.
Figure 3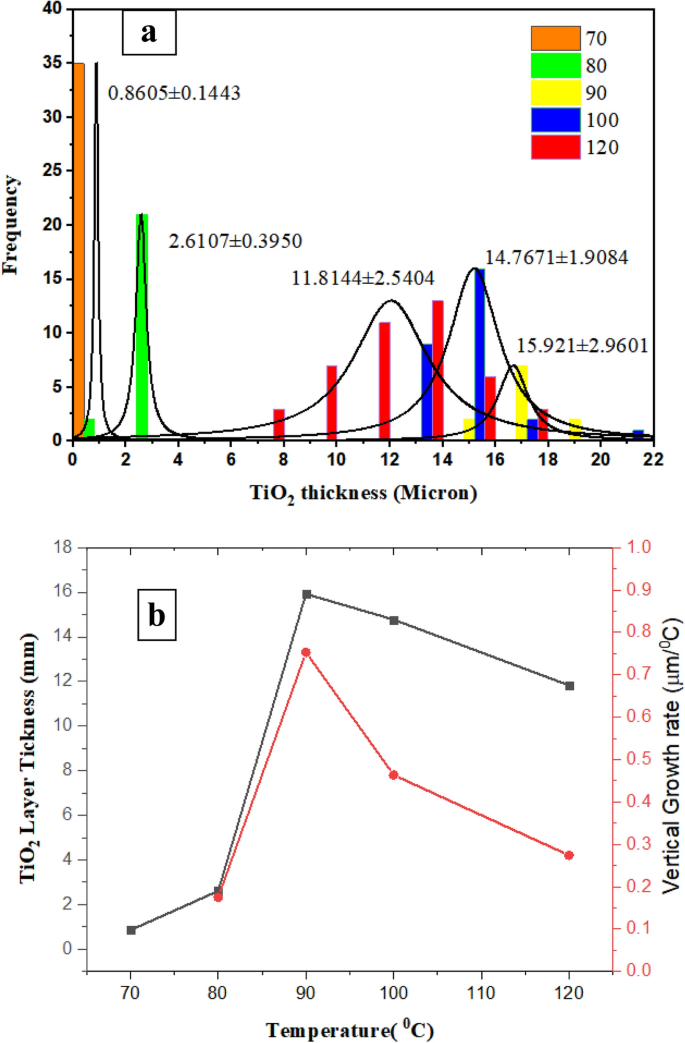
(a) The effect of temperature on (a) Histogram of TiO2 layer thickness, (b) vertical growth rate.
Figure 3b shows a graph of TiO2 layer thickness increase and longitudinal growth. Growth rate ((LT-L70)/∆T) is considered based on the rate of the average thickness increase at each temperature relative to the average layer thickness at 70 °C divided by its temperature difference with 70 °C.
Due to the increase in temperature from 70 to 80 °C, the layer thickness increases from 860 to 2.61 mm. When the synthesis temperature increases from 70 to 90 °C, the layer thickness reaches 15.92 µm, and the growth rate increases more than 4 times. Once the synthesis temperature increases from 70 to 100 °C, the layer thickness reaches 14.77 µm, and the growth rate increases more than 2.5 times. With the synthesis temperature increasing from 70 to 120 °C, the layer thickness reaches 11.82 µm, and the growth rate increases more than 1.25 times.
Surface study of the inner wall microchannel
According to the SEM images shown in Fig. 4, the synthesis at 70 °C resulted in the production of 50 nm particles that are homogeneously dispersed on the surface. A few nanoclusters with a maximum diameter of 700 nm are also witnessed, but they are much smaller in size and frequency compared to the ones detected at higher synthesis temperatures. As the temperature increases, a number of secondary nuclei can be seen, which peaks at 90 °C. At 80 °C, the presence of several particles about 5 microns in length is seen, indicating an increase in the particle size distribution range. At 90 °C, the number of larger particles is greater. At 100 °C more particles are formed with smaller sizes. At 120 °C high surface porosity and particle growth can be seen. EDX results confirm the uniformity of the coating and the presence of titanium dioxide.
Figure 4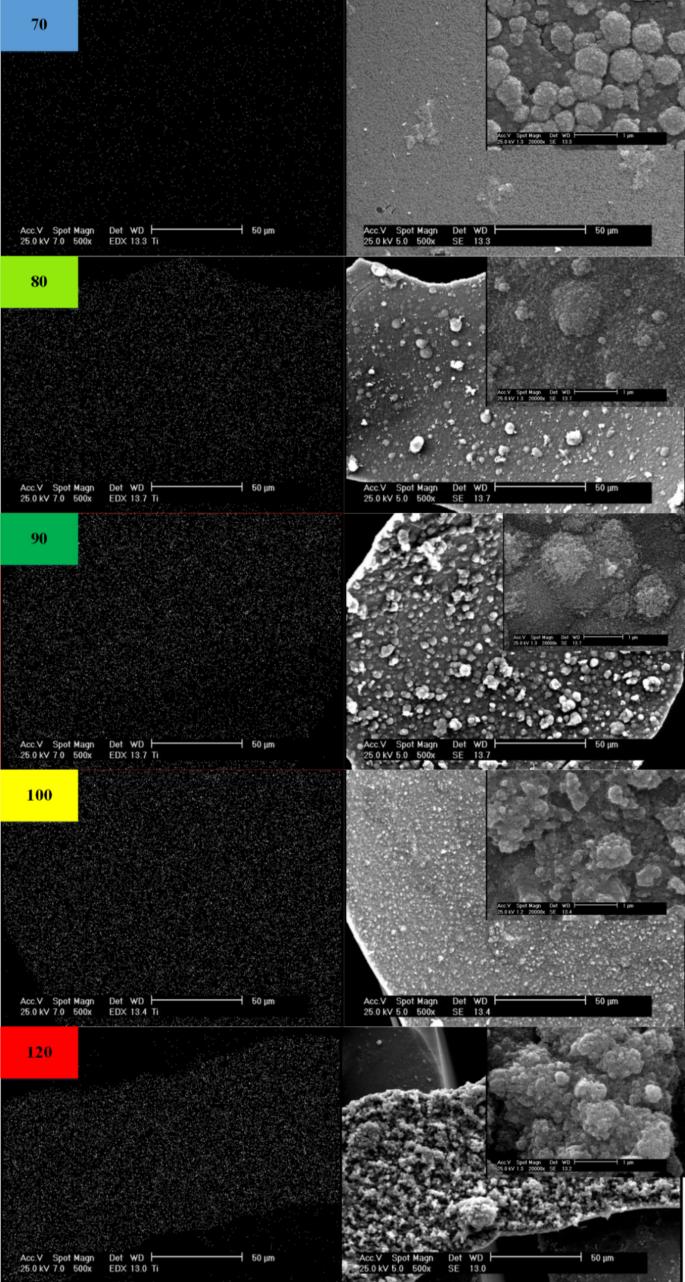
Surface morphology of TiO2 and Ti Elemental mapping at several temperatures.
Hurtado et al. 2016 proved that the photonic efficiency is two orders of magnitude higher in the coated capillary reactor than in the slurry stirred reactor (STR), and it is twice slurry capillary16. It should be noted that an aqueous solution is forced through a micro-packed bed capillary, it will tend to circumnavigate the beads instead of passing through them, which affects the yield of the process17.
How synthesis cycles affects TiO2 size
To investigate the effect of synthesis time on morphology, following the synthesis procedures, the only variable was the synthesis time. Therefore, the precursor solutions are injected into the capillaries for three and five consecutive cycles at 80 °C. A total of 75 and 125 min were devoted to synthesis, and then the capillaries are transferred to a conventional oven and heated at 140 °C for 1 h to make the coated TiO2 layer durable. As shown in Fig. 5, the particle size increases with increasing synthesis time, as well as the cracks on the surface.
Figure 5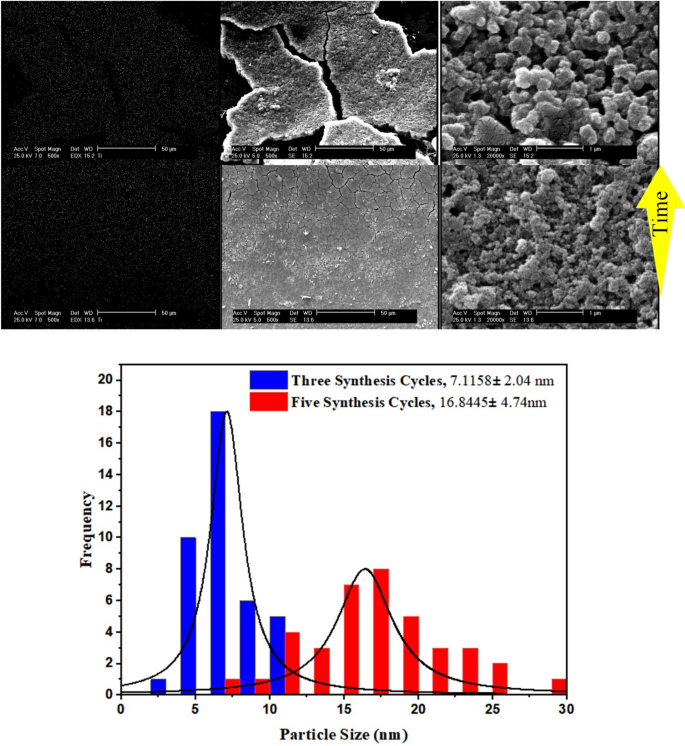
The impact of synthesis time on the microchannel surface coverage and size of TiO2.
The histograms indicates that synthesis time of 75 min leads to TiO2 mean size of 7.11 nm with 2.04 nm standard deviation. Once synthesis time increases to its 1.67fold, both the particle size and size distribution proliferates more than two times.
Crystallographic study of TiO2 powder
The XRD spectrum of samples synthesized at different temperatures in the range of 60–120 °C is given in Fig. 6. It is noted that these samples are collected from the effluents of the capillaries. With synthesis temperature of 60 °C, two anatase peaks of (101) and (200) planes appear. As the temperature rises to 80 °C, the sum of peaks proliferates. (7 peaks for 70 °C and 8 peaks for 80 °C haven been detected). For 70 °C, Anatase peaks at 25.5°, 38.3°, 48.9°, 54.5°, 63.6°, 71.3°, and 76.3° are associated with (101), (004), (200), (105), (204), (220), (215) crystalline planes18. Such peaks are also observed for the sample synthesized at 80 °C, in addition a new peak at 82.1° (224) (Anatase XRD JCPDS Card no. 78-2486).
Figure 6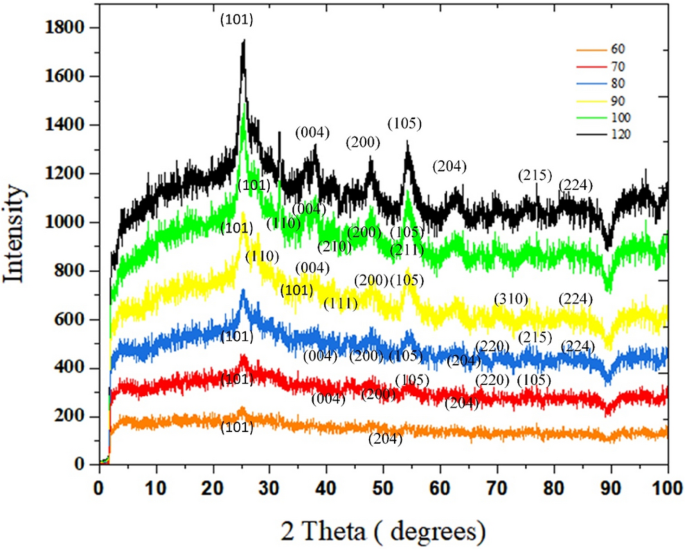
The impact of synthesis temperature on crystalline phases of TiO2 samples in the microfluidic system.
Both phases of anatase and rutile are detected in the spectra of the synthesized samples at 90–100 °C. At 90, Five anatase peaks which are related to (101), (004), (200), (105), and (224) planes are seen, plus four peaks newly formed rutile peaks of 27.4°, 36.3°, 41.1°, 69.8°, which ascribes to (110), (101), (111), (310) 19,20. Once TiO2 is synthesized at 100 °C, as well as (101), (004), (200), (105) crystalline anatase planes, three rutile peaks have been witnessed at 31.7° (110), 45.5° (210), 54.3° (211)20,21,22. In the last spectra, which is related to the sample synthesized at 120 °C, the intensity of peaks has reached the highest quantity. Anatase peaks associated with (101), (004), (200), (105), (204), (215), (224) crystalline anatase planes18,19.
XA (%) is the weight percentage of anatase the samples which consists of both anatase and rutile phases. It is calculated from the following equation:
$${text{XA }} = frac{100}{{left( {1 + 0.26 * left( {IR / IA} right)} right) }}$$
(1)
where “I” represents the maximum peak intensity, A represents anatase and R denotes rutile. The weight percentage of rutile is obtained by subtracting the weight percentage of anatase from 100. According to the XRD results, from 60 to 80 °C, the anatase phase is formed. Increasing the synthesis temperature from 80 to 100 °C has led to partial conversion of anatase to rutile phase. To calculate the crystallite size (D), the Scherer equation (Eq. 2) is used.
$$D=frac{Klambda }{beta COStheta }$$
(2)
where K is the Scherer constant (correction factor related to the sample shape and is equal to 0.9, λ beam wavelength, β peak width at half the maximum height, θ is the diffraction angle.
Average crystallite size (({D}_{ave})) can be resulted from Eq. (3) 23:
$${D}_{ave}={D}_{A}left(frac{{I}_{A}}{{I}_{A}+{I}_{R}}right)+{D}_{R}left(frac{{I}_{R}}{{I}_{A}+{I}_{R}}right)$$
(3)
Table 1 shows that as synthesis temperature rise, crystallite size increments 24,25, but once new crystalline phase is being formed, a decrease in average crystallite size is observed. From 60 to 70 °C, anatase single crystallites grow. The onset of rutile phase formation is 80 °C, the crystallite size gets a bit smaller. The crystal size reduced caused by the burst of nucleation was more palpable than that of the anatase crystal growth accelerated caused by the increase of temperature26. At 90 °C, a considerable quantity of anatase and rutile nucleons with a very small average crystallite size of 8.84 nm have been formed. Increasing the temperature up to 100 °C, the average crystallite size has been doubled. Moreover, in multiphase samples, by increasing the rutile/anatase ratio (0.97–1.17) and increasing the synthesis temperature (90–100 °C), the average crystallite size increases from 8.84 to 18.9 nm. A similar trend is reported in27, where decreasing anatase/rutile ratio from 5.4 to 0.25, and synthesis temperature from 55 to 90 °C, the average crystallites grow from 33.16 to 88.44 nm27. The synthesis temperature of 120 °C leads to pure anatase nucleation and growth, and crystallite size reaches 88.68 nm.
Table 1 Phase and crystallite size of TiO2.
DLS study of TiO2 powder
To have an estimate of the size of TiO2 powder, a series of dynamic light scattering tests have been performed. For sample preparation, a solvent is needed, herein, isopropyl alcohol is used as the liquid medium with a refractive index of 1.36 and viscosity of 1.057 cP. The Pade Laplace algorithm is considered. The findings are summarized in Table 2, as the synthesis temperature rises, the diameters of nanoparticles decrease, and the diffusion coefficient increases. The results are in agreement with Figs. 3 and 4, which notify that near-wall TiO2 nanoparticles become bigger with temperature increase, and therefore, the centered nanoparticles have a descending relationship with temperature. Likewise, with the immobilized TiO2, a sudden increase of size at 90 °C is observed.
Table 2 DLS results about synthesis temperature-size relation of TiO2.
Identification of ZnO nanoparticles
In order to compare the results of the microfluidic system with bulk, the molar ratio of ZnCl2 to NaOH is kept constant at 0.6 with concentrations in the microfluidic system for the first and second streams are 30 and 50 mM, respectively (50 times dilution of the bulk systems). A microfluidic platform for synthesis comes along with more control over reaction, in the meantime, the reduction of chemicals consumption strongly prevents the occurrence of chemical accidents. Especially for highly acidic or basic circumstances. Synthesis time in room temperature spiral microfluidic system has been performed in 15 min V.S 2 h at 100 °C for the bulk approach.
According to Fig. 7, the results of FTIR analysis associated with ZnO synthesis in the bulk and microfluidic system state the existence of identical peaks in the two samples. ZnO stretching vibrations are observed for both methods in the range of 400–668 cm−128. In the range of 870–1000 cm−1, there are Zn–OH peaks that are higher in number and intensity for nanostructures synthesized by the microfluidic method. In the range of 1200–1500 cm−1, the C–OH bond, which can be formed as a result of the OH group due to washing with alcohol, indicates the bending vibration within –OH group in plain29,30. These peaks are seen more in the sample of the bulk method. Carboxylic group (C=O) was observed around 1700 cm−131,32. A peak can be detected at 2300 cm−1, which indicates the atmospheric absorption of CO233. In the range of 2900–2800 cm−1, it shows the peaks related to asymmetric and symmetric stretches of –CH and –CH2 groups. Peaks attributed to OH group stretching vibration have been identified at wave numbers higher than 3600 cm−1. The presence of O–H stretches and hydrogen bonding by alcohol or water molecules can be found in peaks at 3400 or 3300 cm−134,35.
Figure 7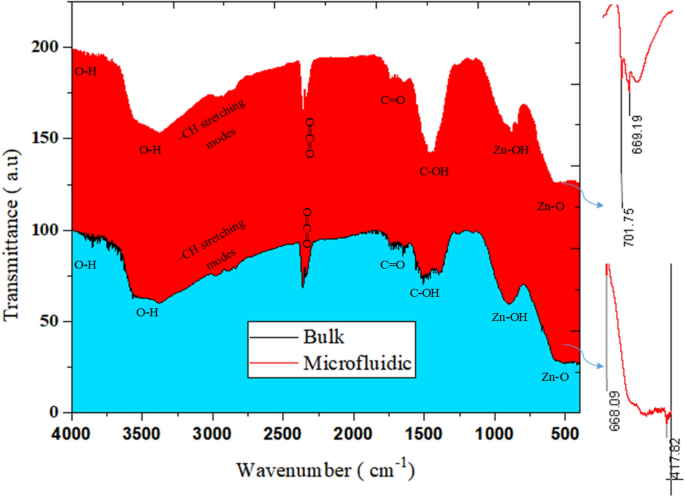
Bulk and microfluidic synthesis of ZnO.
The effect of precursors flowrate on ZnO size
The aim of this section is to investigate the morphology of ZnO nanoparticles synthesized in the spiral system at room temperature. Since the mixing in this type of microreactor is ultrafast, rapid nucleation is expected. A straightforward way is to tune the flow rate which influences the interface concentrations. Therein, the effect of the volumetric flow rate of ZnCl2 and NaOH streams are considered in three cases (1) both: 25 µl/min (2) both: 50 µl/min (3) zinc chloride: 25 µl/min and sodium hydroxide flow: 50 µl/min.
SEM illustrations in Fig. 8 are provided in two magnifications of 500 and 1 µm. In the 1st case, where the volumetric flow of the two streams is low and equal, the residence time is high, leading to larger particles and a broader ZnO size distribution. In the 2nd case, when the flow rate doubles compared to the first case, the nanoparticle size is almost halved and the ZnO size distribution is somewhat reduced. In the 3rd case, where the ZnCl2 flow rate is equal to 25 µl/min and the NaOH flow rate is equal to 50 µl/min, the particle size is intermediate. In addition, the narrowest size distribution is related to this case.
Figure 8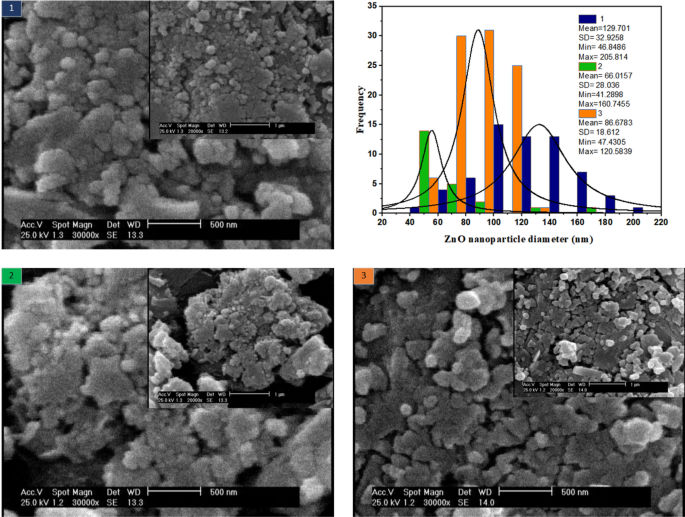
Effect of reagents volumetric flowrate on the morphology of ZnO nanoparticles room temperature synthesis in spiral microreactor.
Biological activity of immobilized enzyme
As an instance, Raman analysis of bio-photo-catalyst with a GOx/ZnO ratio equal to 0.25 is shown in Fig. 9a some assignments of Raman vibrations modes of GOx are shown in the spectrum, which are in agreement with36. The results evidently validate that the remarkable SERS activity of the fabricated bio-photo-catalyst is induced by the synergistic effects of the plasmonic Zn2+37, semiconductor TiO2, and glucose oxidase molecules, not only induced by plasmonic metal Zn nanoparticles. ZnO lattice vibration is associated with a sharp peak at 454 cm−138. At 532 cm−1 corresponds to the oxygen vaccines in the TiO2/GOx/ZnO. The peak at 856 cm−1 is corresponding to TiO239. Moreover, the bioconjugation of ZnO/GOx 40 and the bandgap reduction of TiO2 as a result of doping with ZnO may affect the Raman shift. Pure glutaraldehyde has a strong band at 1125 cm−141 that originates from C−OH stretching. However, crossed linked GOx showed a band at 1146 cm−1. This shifting could be explained by the conjugation of TiO2 and ZnO restricting the vibrations of oxygen.
Figure 9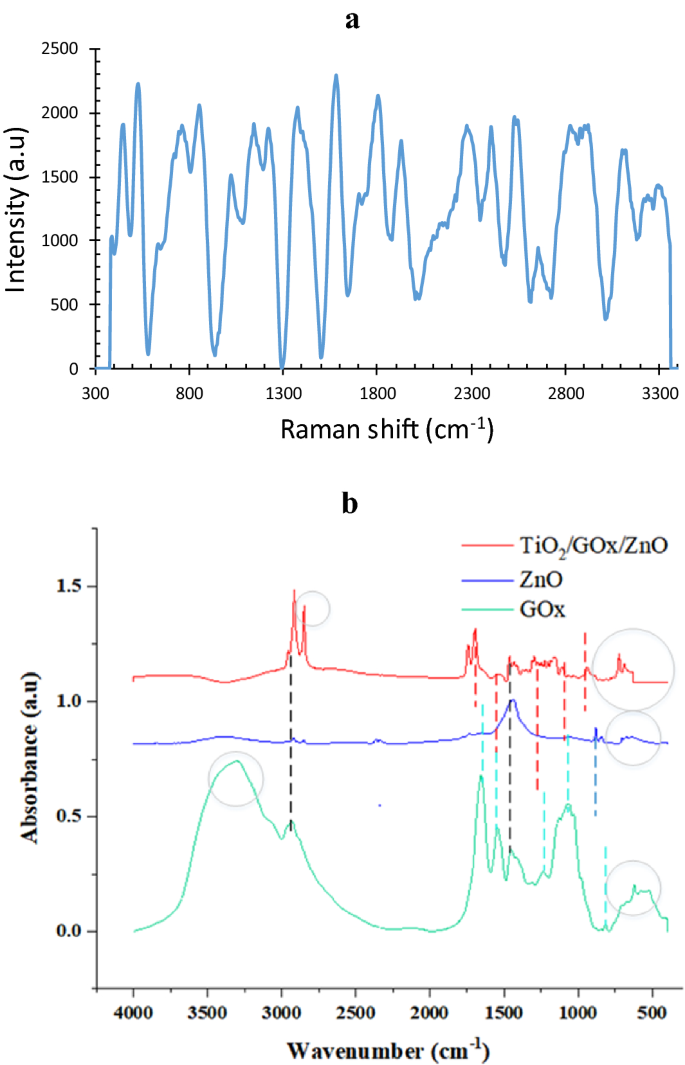
(a) Raman spectra of GOx/ZnO immobilized on TiO2, (b) FTIR analysis of the bio-photo-catalyst components.
The results of FTIR analysis for bio-photo-catalyst components are shown in Fig. 9b. In the ZnO sample, ZnO tensile vibrations were determined with peaks of 701 and 669 cm-128. In the TiO2/GOx/ZnO sample, a peak at 668 cm−1 could correspond to Ti–O–Ti and ZnO42. Two peaks in the range of 900–800 cm−1 refer to Zn–OH29,30. Peaks 939, 1101, 1159, 1206, 1226, 1297 cm−1 are related to Zn-OH and Ti–OH42. The presence of this bond indicates hydrolysis of the precursor 43. For glucose oxidase, a peak at 1062 cm−1 was observed for the stretching vibrations of the C–O bond. In the meantime, this peak with a decreased intensity is detectable in the bio-photo-catalyst Peaks in the enzyme in the range of 1300–1400 cm−1 can also belong to the phenolic group of glucose oxidase44. In the bio-photo-catalyst spectrum, the peak in this region is also observed.
Two types of peaks were observed in all three samples. The presence of peaks in the range of 1400–1500 cm−1 may be related to the (CH)n bonds in the fatty acid or enzyme. Moreover, the C−H stretching modes of α-carbon and the aliphatic carbon chain of glutaraldehyde could be assigned near 2800 cm−141,45,46.
In the spectrum related to glucose oxidase enzyme, the presence of peaks related to amides of the first, second, and third types of peptide structure is also observed. At 1242 cm−1 and 1244, which are related to C–N and C–H tension and N–H torsion47. Receptor bonds of the first type were observed at 1600 cm-1 to 1700, which are related to the tensile vibration of C=O or CO peptide bonds in the protein structure, second amide bonds at 1500–1600 cm−1, NH tension, and C–N tension of the peptide groups. Primary amines are commonly used to monitor structural changes in proteins, and this shows the biological activity of GOx48,49. These peaks coexist in the bio-photo-catalyst, however, compared to pure glucose oxidase, their intensity is diminished due to the bioconjugation. There is also a peak at 1743 cm−1 and 1699 which belongs to the carbonyl group50. In addition, GOx shows amide-related bonds at 3400–3440 cm−1 and amide B at about 2900 cm−1, which originate from the Fermi resonance between the first peak of amide II and the N–H tensile vibration51. The peaks observed in the two samples ZnO and GOx in the range of 3300 cm−1 indicate the presence of surface water and O–H bond42,46. This peak confirms the presence of hydrophilic spots31,32.
Optical study
UV–Vis diffuse reflectance absorption spectra (DRS) of TiO2, GOx, ZnO, TiO2/GOx, TiO2/GOx/ZnO in the range of 300–700 nm are shown in Fig. 10. Anatase TiO2, which is synthesized at 70 °C is utilized in this test. For TiO2/GOx, a shift of the absorption edge to the visible light region is witnessed. After 420.6 nm, the adsorption intensity ascribed to TiO2/GOx/ZnO is higher than bare TiO2.
Figure 10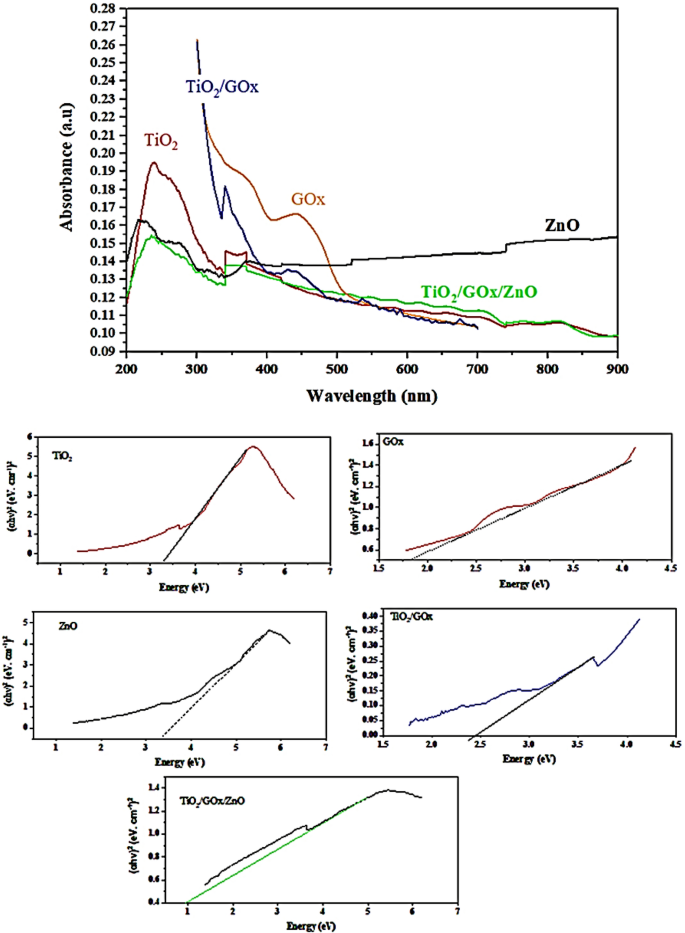
UV–Vis DRS spectra and indirect transition band gaps.
The Tauc method is based on the assumption that the energy-dependent absorption coefficient α can be expressed by (αhν)1/2 or (αhν)2 = B (hν-Eg) where h is the Planck constant, ν is the photon’s frequency, Eg is the band gap energy, and B is a constant52.The corresponding band-gap energy, calculated by using the Kubelka–Munk (KM) method and the plot of (αhν)2 versus the photon energy (hν) for pure TiO2 and ZnO are 3.20 and 3.33 eV, respectively. ZnO/TiO2 heterojunction composite fibers has a bandgap of 2.9 eV53. Binary composite of TiO2/GOx has a bandgap of 2.43 eV, while for the TiO2/GOx/ZnO, bandgap is as low as 1.00 eV. Triple-heterojunction can improve the migration of photo-excited charge carries among different components to enhance photo-activity and charge separation54.
Bio-photo-catalytic degradation of amoxicillin
Amoxicillin synthetic wastewater with concentrations of 10–50 ppm is injected into the bio-photo-catalyst coated microchannel at a speed of 0.5 mm/min. The multiphase reaction has been performed for 1 h under UV light irradiation (0.25 W/cm3).
Figure 11a investigates the effect of synthesis temperature (70–120 °C) on the bio-photo-catalyst activity. In the whole range of synthesis temperature, can fully degrade amoxicillin up to 10 ppm. Figure 11a makes clear that at the same operational time, the lower concentration of amoxicillin and the lower synthesis time of TiO2, the higher the decomposition yield. The more pronounced adverse impact of increments in synthesis temperature rise can be observed in cases with great initial concentrations of amoxicillin. The effect of temperature can be interpreted by the SEM results of photo-catalysts synthesized in the microfluidic system. The photo-catalysts which are synthesized at 70 °C have the smallest diameter and length and size distribution. Figure 11b gives more details on the decrease of amoxicillin adsorption coefficient at different initial amoxicillin concentrations. Figure 11c, d study the effect of time on amoxicillin degradation over the bio-photo-catalysts with synthesis temperatures of TiO2 in the range of (70–120 °C). According to the pseudo first-order reaction, the plot of ln(C0/C) against time should be linear. Kinetics of reaction reveal that apparent rate constants for samples (70–120 °C) are as 0.035, 0.027, 0.0206, 0.0206, 0.0152 min−1, respectively. In the meantime, the behavior of the sample with 70 °C synthesis temperature defines with the highest yield and most rapidly degradation of amoxicillin.
Figure 11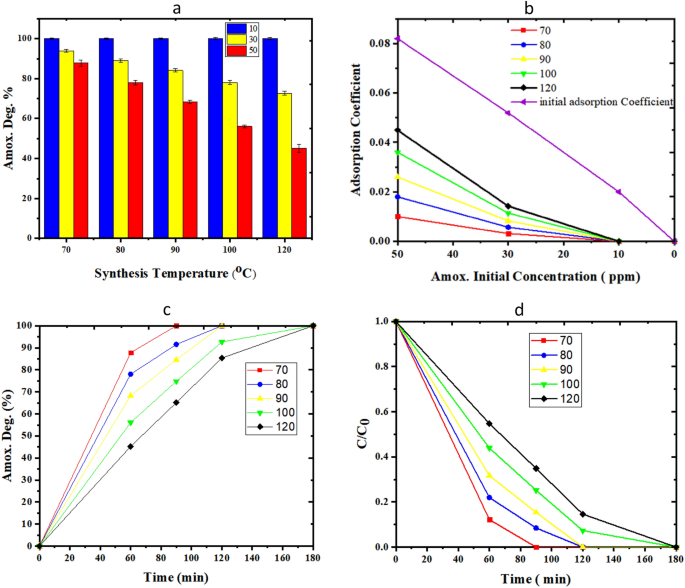
Evaluation of TiO2/ZnO/GOx bio-photo-catalyst assay in Amoxicillin degradation, (a, b) the effect of synthesis temperature and initial amoxicillin (10–50 ppm) degradation over 1 h, (c) the effect of operational time on amoxicillin degradation (0–180 min, initial concentration of 50 ppm), (d) CAmox./CAmox., 0 verses time.
For stability test, amoxicillin solution of 50 ppm illuminated by 0.25 W/cm3 is fed up into the microreactor at 0.5 mm/min. In these series of experiments, the operational stability of the system in seven consecutive cycles is studied. The residence time was 1 h and no rising has been done between cycle intervals. In this work, only 8.1% alteration is seen in the amoxicillin degradation efficiency (Fig. 12). Similar results have been observed in where tetracycline is to be degraded in a microfluidic systems over ZnO/ZnS by 5% change in the efficiency after 5 cycles55. Microfluidic reactors provide uniform conditions of light propagation and flow distribution, which result in homogenous photoactivation of sites, regular interaction between active sites and pollutants, and eventually these systems allow higher stability compared to bulk reactors.
Figure 12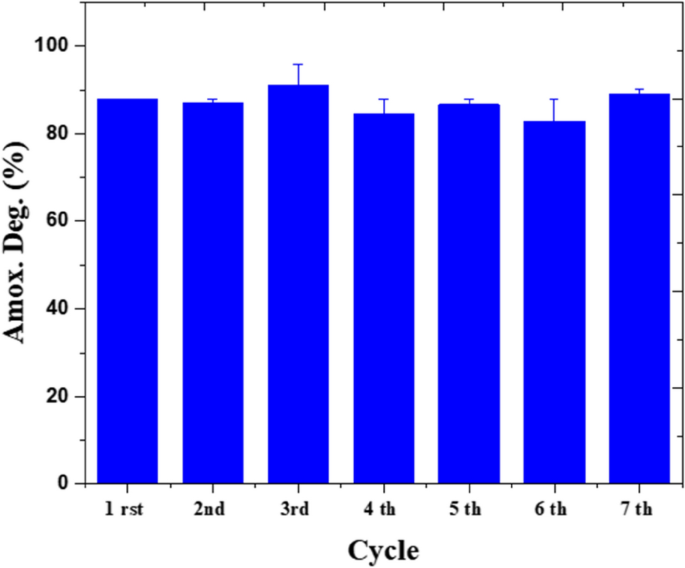
Repeated use of the biophotocatalyst for amoxicillin degradation.
Table 3 summarizes the published articles on the photo-catalytic amoxicillin degradation. In a recent work, the use of commercial titanium dioxide immobilized on the membrane to decompose amoxicillin (50 ppm) is reported in which, it is removed up to 80% after 500 min56. In another work, a hybrid nanostructure of TiO2/WO3 with a calcination temperature of 700 °C has been utilized at a dose of 0.1 g/l to decompose 25 L of amoxicillin (100 ppm) and the intensity of UV solar radiation was set to a constant value, on a pilot scale. They achieved an efficiency of 64%57. TiO2 as a slurry of titanium dioxide (anatase) at a reaction time and light intensity less than the previously stated articles, showed a 70% efficiency in the decomposition of amoxicillin, but its separation from the solution for reuse of photo-catalysts is more difficult58. The slurry sample had a yield reduction of about 13% under similar operating conditions, except that it was fixed on silica gel granules59. Exposure to visible light showed a significant effect of cobalt promoter on increasing the performance of TiO2 in the decomposition of amoxicillin60, which enhanced the efficiency by as much as 70% increase compared to TiO2. In another work, bismuth (as a promoter) and platinum were used to amplify TiO2 in the photo-catalytic analysis of amoxicillin (10 ppm), which achieved an efficiency of 87% in 120 min under visible light61.
Table 3 Comparison of this work with the recent reports on amoxicillin degradation.
In the present work, a TiO2- based bio-photo-catalyst coated capillary has been attained by modification of TiO2 with glucose oxidase and oxide nanoparticles, and the complete decomposition of amoxicillin was irradiated with a 0.25 W/cm3 UV-light source for 120 min at 50 ppm.
ZnO is dopant and it is not as influential as TiO2 is. Therefore, its effect on the result is not that prominent. However, it is worth studying. Two findings are concluded from Table 4. First, it recommends that the microfluidic system is a better environment for ZnO synthesis. Second, size distribution is the key property for achieving higher efficiency. In another word, by tuning the flow rates, a desired size distribution and uniformity can be attained. For instance, once the volumetric flow rate of NaOH is set at 50 µl/min and ZnCl2 at 25 µl/min, a greater amoxicillin degradation and narrower size distribution are attained than the case in which both reagents collide with each other at 50 µl/min flowrate.
Table 4 Comparative systems for ZnO synthesis based on performance evaluation.
Comments are closed.