

Quantification of biological nitrogen fixation by Mo-independent complementary nitrogenases in environmental samples with low nitrogen fixation activity
Direct injection method for ethylene and acetylene δ13C analyses by GC-C-IRMS
Following the direct injection approach of classical ISARA12 with a few modifications, ARA samples with high ethylene yield (> 500 ppmv) in 10% v/v acetylene were manually injected into a Thermo Scientific Trace GC Ultra-Isolink with an Agilent HP-PLOT/Q capillary GC column (30 m, i.d. = 0.32 mm, f.t. = 20 μm) and a combustion reactor connected to a Thermo Scientific Delta V Plus isotope ratio mass spectrometer (GC-C-IRMS; Fig. 1a). Modifications include the replacement of silver ferrules in the GC oven with Valcon polymide (graphite reinforced polymer) ferrules to limit memory effects from acetylene. The combustion reactor was oxidized with pure oxygen for 1 h before each run and brief (15 min) seed oxidations were performed between measurement batches (i.e., required every ~ 6–8 ethylene injections, ~ 4–6 acetylene injections) to regenerate reactor oxidation capacity and minimize drift of δ13C values. See Supplementary Table S1a online for additional instrument settings.
Ethylene Pre-Concentration (EPCon) method
ARA samples with < 500 ppmv ethylene were analyzed using an ethylene pre-concentration system developed based on Weigand et al.35 and fabricated in-house (EPCon, Fig. 1b). The EPCon is a fully automated on-line gas preparation system that uses a series of precisely timed valves, cryogenic traps, and a gas chromatograph (GC) to remove background components (particularly water and acetylene) and concentrate ethylene before it is introduced into the GC-C-IRMS. The EPCon was developed through modification of a similar in-house system designed by Weigand et al.35 to measure nitrogen and oxygen isotopes in seawater and freshwater nitrate35,36,37 and optimized for measurement of low concentration ethylene δ13C. Differences from its direct predecessor35 include direct connection between valve 4 in the EPCon (“V4” on Fig. 1) to the GC column in the commercial GC-C-IRMS system, by-passing the injection chamber to eliminate associated problems (e.g., decreased sensitivity, peak broadening). Flow rates, pressures, valve and trap timings were adjusted to effectively separate ethylene and acetylene such that acetylene could be removed from the analyte stream, and ethylene could be cryogenically focused into a small volume prior to introduction into the GC-C-IRMS. See Supplementary Methods S1 and Supplementary Table S1b-c online for detailed instrument information and settings.
Chemical precipitation of background headspace acetylene
For ISARA samples with less than ~ 20 ppmv ethylene, complete GC separation of acetylene and ethylene within the EPCon system was unachievable under our laboratory working conditions due to extreme mass imbalance in analytes. Prior to EPCon δ13Cethylene analysis of these samples, we performed off-line acetylene removal from sample headspace by chemical precipitation of acetylene with silver nitrate (AgNO3) in ammonia, producing a silver carbide salt34 (Chemical precipitation, Fig. 1c). Ammoniacal AgNO3 solution (0.5 g AgNO3 in 10 mL water) was added to each sample (0.5 mL AgNO3/10 mL headspace containing 10% v/v acetylene). Once the reaction was complete (~ 10 min), sample headspace was transferred to an autosampler vial for EPCon analysis (Fig. 1b), and the remaining carbide salt solution was neutralized (1 mL of 5 N HCl). Complete acetylene removal was verified by analyzing it on a gas chromatograph with a flame ionization detector (GC-FID). We estimated the influence of chemical precipitation of acetylene on δ13Cethylene values using control samples made with 2000 ppmv ethylene (from tank EY-4) with and without the addition of 10% v/v acetylene (n = 3, Table 1). Given the highly reactive nature of the silver carbide salt product of precipitation when dry, acetylene precipitation needs to be handled with great care34 and it was only performed as necessary in this study (e.g., sample ethylene < 20 ppmv).
Quality controls and data processing
To ensure continuity between our sample analyses within-runs and in the long term (between runs), we used commercially available ethylene and acetylene gas tanks as in-house tank standards (ethylene EY-4, EY-8, acetylene AY-1, AY-4, Table 1) for drift correction and daily quality assurance checks. Quality control standards to test IRMS and EPCon performance were analyzed before each batch of samples that were run. All δ13Cethylene measurements produced by the EPCon-GC-C-IRMS during long (~ 30 h) runs were corrected for drift in instrumental response over time relative to the drift correction standard (EY-4) that was measured at uniform intervals throughout sample runs using linear interpolation between drift correction standards. A second standard (EY-8 or a separate batch of EY-4 standards) was used to independently validate the drift correction process. Data from direct injections were processed according to the classical method described by Zhang et al., 201612, and did not require drift correction due to the frequent seed oxidations of the reactor. See Supplementary Table S2 online for sample loading details with placement of quality control check standards and Supplementary Data S1 online for data processing calculations.
Analytical method validation
For each measurement method (i.e., direct injection, EPCon, and chemical precipitation + EPCon), we determined the sensitivity, limit of quantification, linearity range, intraday repeatability, and within laboratory reproducibility (as defined in Carter and Barwick, 201138) by repeated analysis of the main in-house ethylene tank standard (EY-4) under various conditions (Table 1). Sensitivity was determined by linear regression of the IRMS response mass 44 signal (area in volt seconds [Vs]) relative to the amount of ethylene carbon (C) loaded (in nmols C). Linearity range was defined by the lowest and highest quantities of ethylene C that could be directly injected into the GC or loaded into the EPCon autosampler to obtain a mass 44 peak amplitude of 1–6 V (typical conservative analytical range). Samples were loaded with a goal of ~ 2 V for the mass 44 signal. Repeatability (i.e., intraday variability) was estimated as the average of the standard deviations for each day over 26 days for the EPCon, and 6 days for direct injection. Within lab reproducibility was calculated using the standard deviation of average δ13C measurements for each day over 26 days for the EPCon and 6 days for direct injection.
The limit of quantification (LOQ) was determined based on the minimum ethylene concentration (in ppmv) that could be measured using each method. The technical LOQ, based on ethylene standards and samples with no acetylene, is bounded by the minimum accepted peak amplitude (1 V for mass 44) and the maximum loading volumes for each method (direct injection, 1 mL as constrained by injector and GC column loading; EPCon and chemical precipitation methods, 20 mL as constrained by autosampler vial volume). The methodological LOQ for samples with a 10% matrix, set by the maximum loading volume that avoids overloading the system with acetylene, is 0.5 mL for acetylene and 1.5 mL for EPCon. The methodological LOQ when chemical precipitation was used is ~ 2 ppmv, the lowest sample concentration before the background ethylene concentration carried over in acetylene generated from calcium carbide is greater than ethylene from sample acetylene reduction.
Bacterial cultures
Azotobacter vinelandii mutants utilizing only Mo-nitrogenase (‘MoNase’ mutant, strain CA70.139) or only V-nitrogenase (‘VNase’ mutant, strain CA11.7040) for nitrogen fixation were grown aerobically at 30 °C in a modified Burks medium12,41 with 100 nM to 1 µM NaMoO4 (strain CA70.1) or NaVO3 (strain CA11.70). CA70.1 is a double gene deletion mutant (ΔvnfDGK::spc, ΔanfHD70::kan) that expresses only the nif genes (Mo-nitrogenase). CA11.70 is also a double gene deletion mutant (ΔnifHDK, ΔanfHD70::kan) that expresses only the vnf genes (V-nitrogenase). Exponential phase cells (OD620nm ~ 0.3–0.8) were sampled to initiate acetylene reduction assays. See Supplementary Methods S2 online for details.
Figure 2
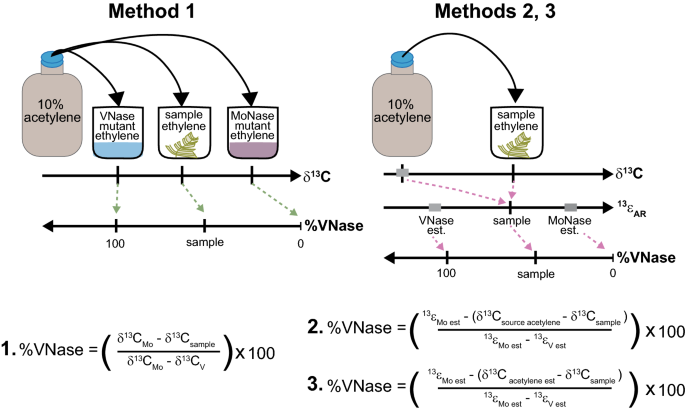
Overview of direct δ13Cethylene and 13εAR (= δ13Csource acetylene – δ13Cethylene) scaling methods for converting sample δ13Cethylene values to percent acetylene reduction by V-nitrogenase (%VNase). In the direct scaling method 1, the same batch of source acetylene is used in ARA incubations of Azotobacter mutants expressing only Mo or VNase as for the environmental samples, precluding the need to measure δ13Csource acetylene and enabling %VNase to be calculated based solely on δ13Cethylene. Following 13εAR scaling methods12, different batches of acetylene can be used for sample and single nitrogenase calibration (e.g., mutant) ARAs; measured (method 2) or estimated (method 3) values of ẟ13Csource acetylene along with measured δ13Cethylene for each batch of ARAs are used to calculate 13εAR values, which are then converted to %VNase by comparison with 13εMo and 13εv. See Method section above and Supplementary Methods S5 online for equation details.
Environmental samples
Natural surface samples (moss, cyanolichens, leaf litter, topsoil, decaying wood) and wood-feeding termites with low BNF activity were assessed for complementary nitrogenase activity. Samples were collected from forested sites in central New Jersey (Institute of Advance Studies, Stony Ford Reserve, Pine Barrens, Watershed Institute) and New Hampshire (Mount Moosilauke) from 2019 to 2021. At each site, triplicates of each sample type were collected from one or more stations (10 m × 10 m per station separated by 500–1000 m). Samples, stored at room temperature, were assessed by ARAs within 5 days of collection. Wood-feeding termites (genus Zootermopsis) were obtained from Ward Scientific (https://www.wardsci.com) and maintained within controlled laboratory habitats for 2–16 days prior to ARA. See Supplementary Methods S3 and Supplementary Table S3 online for details.
Acetylene reduction assays
Acetylene reduction assays42 (ARAs) were performed on Azotobacter cultures and environmental samples using 10% v/v acetylene generated from calcium carbide. Headspace ethylene concentration was monitored by GC-FID. See Supplementary Methods S2, S3 and Supplementary Table S3 online for ARA details.
Azotobacter ARAs were conducted at 30 °C, 200–250 rpm shaking in 25–240 mL serum bottles sealed with 20 mm blue butyl stoppers (Bellco), containing 10% by volume of cell culture and a starting headspace composition of 90% v/v air and 10% v/v acetylene. Headspace gas was transferred to evacuated serum vials (10 mL) with 20 mm blue butyl stoppers (Bellco) to be saved for later IRMS analysis once headspace ethylene concentrations reached 100–2200 ppmv (MoNase strain, typically within 4 h of incubation) and 50–200 ppmv (VNase strain, within 6 h of incubation), yielding in-house ethylene scaling standards EY-Mo-1 and EY-V-1 (Table 1, Fig. 2).
Field sample ARAs were conducted in 100–500 mL glass canning jars (Mason, Ball) with metal lids fitted with 20 mm blue butyl stoppers (leaf litter, soil, and wood, Supplementary Table S3); in 30 mL glass vials with screw caps fitted with PTFE/silicone septa (moss, lichens, soil, Supplementary Table S3); or in 15 mL serum vials sealed with 20 mm butyl stoppers (termites, Supplementary Table S3). Control incubations (no acetylene added) were performed with leaf litter, soil, decaying wood (Mt. Moosilauke, Pine Barrens), moss and lichens (Mt. Moosilauke), and termite samples to assess natural endogenous ethylene production independent of acetylene reduction. ARA incubation times for environmental samples varied from ~ 2 to 300 h (Supplementary Table S3) depending on the rate of ethylene production, with a goal of obtaining at least 20 ppmv ethylene. Sample weights for ARA incubations were variable due to sample availability and estimated ethylene production rate, and are listed for each location and sample type in Supplementary Table S3. ARA headspace was subsampled (≤ 3 mL) to measure ethylene concentration by GC-FID, and the remaining headspace was transferred to evacuated sealed vials (10 mL) for later isotopic analysis.
Background ethylene correction
Due to low BNF activity, δ13Cethylene was corrected for isotopic influence of background ethylene (~ 2 ppmv) carried over into ARAs by 10% v/v source acetylene (See Supplementary Methods S4, Eqn. S1 online). Background correction was required for ARA samples producing < 20 ppmv ethylene; no quantitative information on nitrogenase could be derived from samples producing < 5 ppmv ethylene due to the isotopic influence of background ethylene. For ARAs yielding ethylene > 5000 ppmv (i.e., 5% of acetylene concentration), δ13Cethylene was also corrected for Rayleigh fractionation12,43.
Direct δ13Cethylene and 13εAR scaling methods to quantify complementary nitrogenase contribution
One of three methods (Fig. 2) was used to quantify the contribution of complementary nitrogenase to acetylene reduction (as %VNase or %FeNase) in ARAs using δ13Cethylene and δ13Cacetylene. The scaling method used was dependent on whether precise measurements of source δ13Cacetylene values were achievable, given sample availability and technical difficulties in chromatography and combustion. EPCon-GC-IRMS was used to measure δ13Cethylene. All δ13Cacetylene measurements were made using the direct injection approach. See Supplementary Methods S5, Supplementary Table S4, and Supplementary Data S1 online for expanded calculation details.
Method 1- The direct scaling approach (Fig. 2), which circumvents the need to measure δ13Cacetylene, was used to calculate complementary nitrogenase contribution when the same source of acetylene stock was used in environmental sample ARAs as a set of calibration ARAs performed with MoNase and VNase strains of Azotobacter vinelandii. Measured δ13Cethylene in environmental sample ARAs is converted to %VNase using endmember δ13Cethylene values (e.g., ethylene scaling standards, Table 1, Fig. 2) diagnostic of 0% and 100% VNase activity generated, respectively, by MoNase and VNase Azotobacter calibration ARAs (See Supplementary Methods, S4, Eqn. S3 online). See Supplementary Methods S2 online for details on setup and analyses of Azotobacter ARAs.
When source acetylene stock used in sample ARAs was not processed in Azotobacter calibration ARAs, we quantified complementary nitrogenase contribution using classical ISARA approaches12 (Fig. 2, methods 2 and 3), which require knowledge of both sample δ13Cacetylene and δ13Cethylene to account for isotopic variation in different acetylene stocks in calculations of 13εAR (= δ13Cacetylene – δ13Cethylene).
Method 2- The δ13Cacetylene of different acetylene stocks used in sample and Azotobacter ARAs, measured with the direct injection method, was used with sample δ13Cethylene to calculate 13εAR, followed by calibration to the %VNase scale using 13εV and 13εMo of Azotobacter and other diazotrophs, Rhodopseudomonas palustris and Anabaena variabilis (Fig. 2, Supplementary Methods S5, Supplementary Table S4, Supplementary Data S1; calculation modified from Zhang et al., 201612).
Method 3- When precise measurement of δ13Cacetylene by direct injection for the specific stock of acetylene within an ARA was unachievable, we used the mean and standard deviation of δ13Cacetylene for seven different batches of acetylene generated from calcium carbide over the past 4 years (δ13Cacetylene = 14.9 ± 0.9 ‰, n = 8; Supplementary Fig. S1; Eqn. S5) in 13εAR calculations. %VNase was calculated using 13εV and 13εMo values from Azotobacter and other diazotrophs as in method 2 (Fig. 2, Supplementary Methods S5, Supplementary Table S4, Supplementary Data S1).
Unstable growth of the A. vinelandii Fe-only nitrogenase strain (RP1.1144, ‘FeNase’ mutant) precluded calculations of %FeNase based on Azotobacter. Calculations %FeNase (Fig. 2, Supplementary Method S5, Table S4, Data S1) used EPCon derived 13εFe = 5.2 ± 0.7‰ (s.d.) from Rhodopseudomonas palustris using only FeNase12 in ARAs . Because 13εFe < 13εV < 13εMo12, significant FeNase activity can lead to %VNase values > 100% (i.e., 100% FeNase is equivalent to ~ 140% VNase; Supplementary Table S4). Estimated uncertainty on the %FeNase scale is at most ~ 20%.
Complementary nitrogenase contributions to N2 fixation and isoform adjusted total N2 fixation rates can be calculated using %VNase or %FeNase contribution to AR (see above) and R ratios specifying the rate of AR to N2 fixation for each nitrogenase (e.g., RMoNase = 4 , RVNase = 2, RFeNase = 0.5)12.
Comments are closed.