

Salt tolerance QTLs of an endemic rice landrace, Horkuch at seedling and reproductive stages
Phenotypic traits vary between cross direction in both developmental stages
In our previous study, we used this bi-directional F2:3 population to examine the effect of salinity on various growth, yield and physiological parameters of rice as well as the role of cytoplasm on these traits and reported that maternal inheritance contributed to salt tolerance for F3 progenies48. Rice is most susceptible to salinity during seedling and reproductive growth stages. In the current study, we focused on a subset of phenotypes from Elias et al.48 that can potentially mediate stress during salinity treatment at these two developmental stages and more directly assess the effect of cytoplasm-nuclear interaction leveraging this bi-directional mapping population. For the seedling stage, we evaluated traits that were related to survival, photosynthesis and mineral elements in leaves and for the reproductive stage treatment, we focused on yield-related parameters.
We found a striking difference between the two parents for many of our measured traits across both stages of salt treatment (Supplementary Table S1). As reported in previous studies, we found that Horkuch is more tolerant to salinity (measured by SES score) compared to IR29 which is highly sensitive for salt at the seedling stage (p-value < 0.01). For reproductive stage salinity treatment, these two parents show significantly different responses for ET, SF, FGW, DF and HI where the Horkuch parent had higher ET, SF, FGW and HI. For progenies, we found many traits were significantly different as a result of cytoplasmic background (Supplementary Table S1, Fig. 1). TChlr, TNa, TK and K/Na were found to differ significantly among the Horkuch♀ and IR29♀ at the seedling stage treatment. For reproductive stage treatment PE, TT, ET, FGN were found to differ significantly between these two parental cytoplasms. This observation indicates that cytoplasm can explain a significant amount of variation in the population.
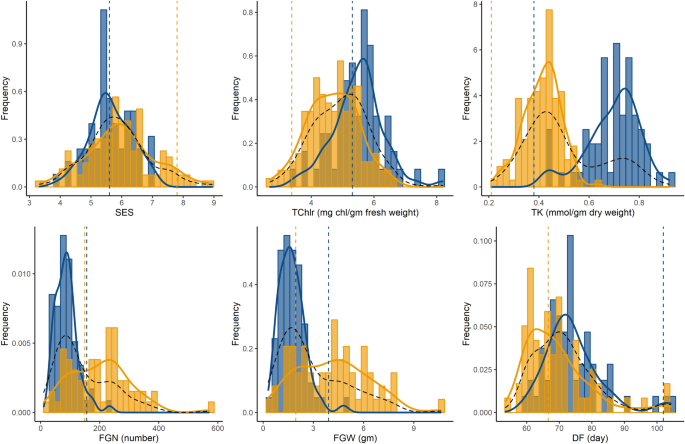
Figure 1
Frequency distribution of traits showing transgressive segregation in the F2 population and the individual subsets of cross directions. Blue and orange histograms indicate samples from Horkuch♀ and IR29♀ cytoplasm respectively. Curves in blue and orange indicate distribution plots of Horkuch♀ and IR29♀ cytoplasm respectively and dotted curve in black indicates the distribution plot of total population. Parental values are marked by a dotted vertical line where blue indicates Horkuch and orange indicates IR29.
Subsequently, we investigated the role of cytoplasm on the transgressive segregation of these traits. In this experiment we found that SES, SRWC, TChlr, TK, FGN, FGW clearly segregate transgressively (Supplementary Table S1). Interestingly, TK, TChlr, FGN and FGW showed significant differences in the two reciprocal crosses and demonstrated a biomodal distribution with respect to their maternal background. The distribution of TK showed a strong bimodal pattern with very little overlap of distribution between cytoplasmic backgrounds (Fig. 1). This observation is indicative of an important role of cytoplasm on transgressive segregation for this population.
To understand the partitioning of genetic variation, we used principal component analysis of 130 families which had complete observations of all traits for both the stages of treatment. The first two PC axes comprise the majority of genetic trait variation in this population (31.3%) and 17.9% respectively (Fig. 2). The first principal component separates individuals into two groups almost exclusively depending on their respective cytoplasm. This observation further supports a significant role of cytoplasm on the performance of a plant under different treatment stages. We also found a moderate correlation of some traits between these two different stages of treatment: PH showed positive correlation with SL and yield related traits such as FGN, FGW, SF, HI and PE is negatively correlated with TK (Fig. 2). This correlation suggests some possible shared mechanisms of salinity responses which trades off between two different treatment stages.
Figure 2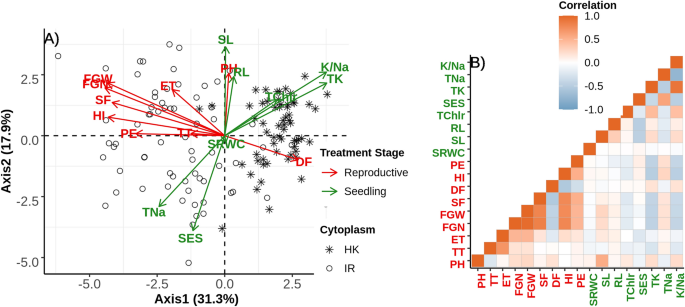
(A) PCA on trait correlations in the F2 mapping population. Each point represents the genetic means of each F2 family whereas the shape of point indicates the cytoplasm (cross direction). Direction of variation for axis 1 and 2 of each trait has been plotted as arrow and are color labelled depending on two different treatment stages: green indicates Seedling stage treatment and red indicates reproductive stage treatment. Labels of traits are printed close to the arrow-head. (B) Plot shows the correlations of traits where brown color shows positive correlation and light-blue indicates negative correlation. Traits labelled with green color indicates seedling stage ones and red indicates reproductive stage traits.
Linkage map construction
In our previous study we constructed a linkage map for another subset of this population by applying a ddRAD technique47. Unfortunately, we had high genotyping error and inflated segregation distortion for many loci for the two parental alleles for a given locus. As a result, we failed to effectively cover the genomic space, including poor sample of the entire space represented by chromosome 5. In this study, we genotyped using Diversity Array Technology coupled with Sequencing (DArTSeq) technique in order to reduce genotyping error and genome representation by adding higher sequence coverage. DArTSeq can generate low to moderate density SNP information with high coverage and low cost. This method uses restriction enzymes to reduce the complexity of the genome and has been optimized for various plant species to achieve optimal complexity reduction. We used this platform for our mapping population to generate genotype information at ~ 10 thousand loci that are well-distributed in the rice genome. We obtained 2230 high quality SNPs that are polymorphic homozygous SNPs for the parents and has < 50% missing data for population. Subsequently, we dropped markers which demonstrated significant segregation distortion or very low recombination and obtained a final map of 499 markers with a map size of 2004.8 cM and average inter markers distance of 4.1 cM (Supplementary Fig. S1A). The maximum gap of 22.3 cM was found in chromosome 5. Chromosome 7 had the fewest markers (22 markers). Supplementary Figure S1B presents the concordance of genetic map with the physical map of rice genome. As mentioned earlier, we detected significant association of cytoplasm for multiple traits in both stages of treatment and therefore we tested (Chi-square test of independence, see “Methods” section) for cytoplasm-nuclear association for each marker in this genetic map. We detected 10 loci that showed significant cytoplasm-nuclear association [FDR < 0.1] and these are mostly clustered in chromosomes 2, 3 and 7. This association suggested the presence of non-random cytoplasm-nuclear allelic assortment in this mapping population resulting from selection at the reproductive stage during the development of the mapping population. Overall, we constructed a linkage map with moderate marker density that was closely aligned with the physical map of the rice genome.
Significant QTL at both growth stages
QTL for seedling stage treatment
We measured eight traits that reflect the survival performance of rice seedlings under salinity stress. We detected six QTLs for three traits: SL, RL and TK (Table 1, Fig. 3). We found three significant QTLs for SL occurring at qSL.1@183 (reporting a QTL for SL located at chromosome 1 at 183 cM), qSL.3@218, and qSL.5@160. For these QTLs, the positive alleles were from Horkuch parent and we detected no significant cytoplasmic effects or interactions. The QTL at qSL.1@183 had a large effect corresponding to a ~ 3.5 cm increase in seedling length with a confidence interval of 3.5 Mbp and localized at the end of chromosome 1 (~ 38.4 Mbp). The second QTL, qSL.3@218, had a small confidence interval of ~ 1 Mbp but the effect size was moderate. The third QTL at qSL.5@160 had a very large confidence interval (~ 9 Mbp) with small effect size.
Table 1 Estimated QTL models: effect and localization.Figure 3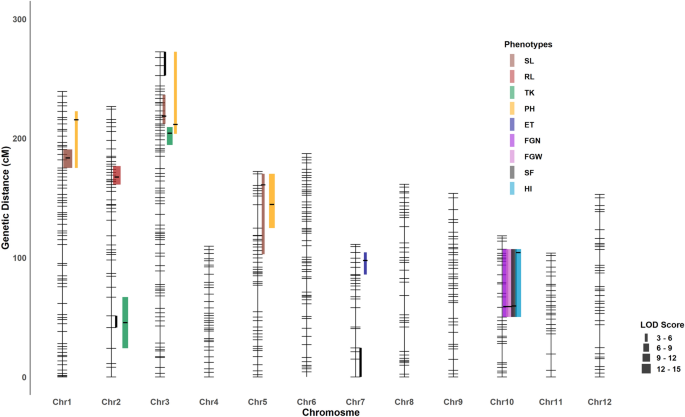
Illustration of QTL across chromosomes. QTL are denoted as a point and 1.5 LOD drop confidence intervals extended to a true marker is indicted by the bar for each QTL. Peaks of the QTL were marked as black line in QTL intervals. QTL from same trait are marked with same color. Line width represents the magnitude of LOD score. Genomic regions that showed significant association with cytoplasm are marked here with black line segment.
We identified one large effect QTL for RL at qRL.2@167 with a confidence interval of ~ 4 Mb. Here, the Horkuch parent contributed the positive allele. For TK, cytoplasm was a significant covariate that interacted with two QTLs which were detected at qTK.2@45 and qTK.3@203. In addition, the QTL qTK.2@45 is co-localized with the cluster of genetic loci that showed significant cytoplasm-nuclear association. The other QTL for TK, qTK.3@204 did not overlap with the association cluster in chromosome 3 but resided in close proximity. This evidence suggests a possible role of cytoplasmic-nuclear interaction for this trait.
QTL for reproductive stage treatment
For this stage, our primary focus was on yield responses of the plants under salt stress. We found 8 QTLs for 6 traits under salinity treatment at reproductive stage (Table 1, Fig. 3). A major effect QTL for FGN was found on Chromosome 10 at 58.5 cM ([email protected]). Here, the IR29 parent contributed the positive allele. We found significant cytoplasm-nuclear interaction for this QTL model where the IR29 allele had positive effects only for IR29♀ (Fig. 4). However, this QTL had a very wide confidence interval of ~ 6 Mbp. We found two co-localized QTLs in this same region including a QTL for FGW and another for SF at [email protected] and qSF.10@59 respectively. These two QTLs also had significant interactions with cytoplasm in their corresponding QTL models. IR29 contributed the positive allele for both [email protected] and [email protected]. For FGW, as like FGN, the IR29 allele had a positive effect only for IR29♀ but for SF this allele not only had positive effect for IR29♀ but also had a negative effect for Horkuch♀. We also found a QTL for HI at qHI.10@104 for which the positive allele was from IR29. However, this model only had an additive effect of cytoplasm.
Figure 4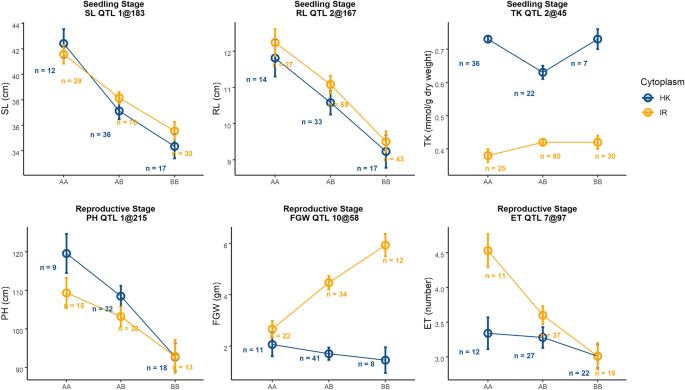
Interaction plots of allelic effect of QTL and cytoplasm on different traits from two different treatment stages. Blue line shows plants with Horkuch cytoplasm whereas orange line indicates plants with IR29 cytoplasm. Alleles are plotted on x-axis where AA, AB and BB indicate homozygous Horkuch, heterozygous of Horkuch/IR29 and homozygous IR29 respectively. Allelic means ± SE are reported. Representative QTL effects for SL and PH are presented in the upper panel and exhibit no significant interaction with cytoplasm. The third plot from the left on upper panel demonstrates significant additive effects of the maternal cytoplasm on TK. In the bottom panel, plot two and three from the left demonstrate significant interaction of QTL alleles with cytoplasm for traits such FGW, ET.
Another QTL, qET.7@97 cM was detected for ET where the Horkuch parent contributed the positive allele. Similar with the other grain related traits, cytoplasm contributed significantly to this QTL model. However, the positive allele from Horkuch performed better in IR29♀. We also found three PH QTLs occurring at qPH.1@215, qPH.3@211 and qPH.5@144, for which the positive alleles were from the Horkuch parent. The first two QTL models showed only additive contribution of cytoplasm but the third showed also an interactive effect of cytoplasm. Overall, we found a hotspot of QTL on chromosome 10 for multiple parameters related to yield. The significant correlation of these traits may reflect related metrics of yield performance in rice.
QTL co-localization
In this study, we found that some QTL intervals of various traits overlapped, therefore we annotated these overlapping intervals as QTL clusters. We detected a co-localized QTL at 1@175:220 cM [QTL Cluster 1 (QC 1)] affecting PH and SL from two different stages of treatment. These traits represent the vigor of plants at the two different growth stages and had significant positive correlation (Pearson’s correlation coefficient = 0.54). In parallel with this correlation, these two QTLs had positive alleles from the Horkuch parent and therefore may play a role in driving this correlation at the trait level. Another wide co-localized cluster was found at 3@194:273 cM [QTL Cluster 2 (QC 2)] impacting SL, PH and TK with the positive allele from the Horkuch parent. However, TK showed no significant correlation with PH which was causal for the co-localization for QC1. A third QTL Cluster 3 (QC 3) was found at 5@144:170 for SL and PH where the positive alleles were from Horkuch parent. The fourth QTL Cluster (QC 4) at 10@58:107 was found for four yield related traits including FGN, FGW, SF and HI for which the positive alleles were from the IR29 parent.
In an earlier study47 the same mapping population had been implemented to examine the genetic basis of salinity response with a different QTL analysis framework in which the genetic map had been constructed by using Double digest restriction site-associated DNA (ddRADseq) technology. However, that genetic map failed to represent more than half of the genomic space due to erroneous genotyping and high rate of missing SNP calls. Nevertheless, in that study several QTLs for the traits studied in this current work had been detected. In order to compare the QTLs identified in these two studies we tested for overlaps between QTL intervals for a given trait (SL, RL, TNa, TK, PH, ET, FGN, FGW, or HI) and categorized QTL as: Category 1: found in both studies, Category 2: found in both studies by relaxing the threshold of type-I error for this current study, Category 3: found exclusively in this study, and Category 4: found exclusively in Noor et al.47. For category 1 we could not detect any QTL which overlap between these two studies without lowering the threshold for type-I error. However, in category 2 we detected one QTL peak each for TK and TNa on chromosome 10 at ~ 18 Mbp while lowering the permutation threshold in our study. In category 3, there are 14 QTLs (Supplementary Table S6) for which the QTL intervals span the genetic space which was uncaptured in the earlier study. We detected 5 QTLs in category 4 which were clusters in one single hotspot of the earlier genetic map. This hotspot was at chromosome 11 which span ~ 18 Mbp to ~ 19 Mbp genomic region and careful investigation of the LOD profile revealed that one single marker was the causal reason for high LOD peaks for the QTL detected at that given interval for majority of the traits which were highly correlated with each other (TNa, TK, FGW, FGN and HI).
GO enrichment analysis of candidate genes within QTL confidence intervals
To understand the molecular mechanism of salt tolerance, we further investigated the function of candidate genes that were located within the QTL confidence intervals (Supplementary Table S3). We applied GO enrichment analysis on the candidate gene lists against the genome-wide background frequency of GOs. The results for GO enrichment analysis have been provided in Supplementary Table S4. For the seedling stage, the QTL at qSL.1@183 showed significant enrichment of GO terms such as pollination, protein lipidation, lipoprotein and liposaccharide metabolic process, various transport and DNA-directed RNA polymerase complexes. Another QTL for SL at qSL.3@218 was significantly enriched with the GO terms such as protein transport and localization, amide and lipid transport, cytoskeleton and actin binding. The third QTL for SL, qSL.5@160 had significant enriched GO terms for chromatin assembly, nucleosome organization, DNA packaging, ion transport, amide and peptide transport. QTL qRL.2@167 showed significant enrichment of GO terms such as carboxylic, dicarboxylic and C4-dicarboxylate transport, malate transport, anion transport and sexual reproduction. Two QTLs for TK, qTK2@45 and qTK3@204, were both enriched with the GO terms oxidoreductase activity, various transmembrane transporter activity, potassium ion transmembrane transporter and cation transmembrane transporter.
For traits at reproductive stage, the QTL qPH.1@215 was significantly enriched with the GO terms anion and potassium ion transmembrane transport, divalent metal ion transport, pollination, reproduction process, endoplasmic reticulum and organelle sub-compartment. Another PH QTL, qPH.3@211 showed enrichment for GO terms such as cellular nitrogen compound metabolism, organic acid transport, mitochondrial membrane and protein complex. The third QTL, qPH.5@144 also showed significant enrichment for nitrogen compound metabolic process. This QTL was also enriched for various mitochondria and cytoplasm related GO terms. The QTL, qET.7@97 was enriched with cytoplasm and mitochondrial membrane part and chlorophyll metabolic process. QTLs for FGW, FGN, SF and HI share the same QTL intervals therefore the gene models within this interval were identical. This interval was enriched with cell wall macromolecule catabolic process, amino sugar and glycan metabolic process, protein localization to organelles and mitochondrial transport. The significant enrichment of mitochondrial and organelle related GO terms for some QTL confidence intervals suggests a possible explanation for the significant cytoplasm and cytoplasmic-nuclear interactions detected in our study.
For QTL models that had significant cytoplasmic effect, 1473 annotated genes are present in the respective confidence intervals. In our previous studies we tested for the association of gene expression to salinity stress for this same reciprocal mapping population at seedling and reproductive developmental stages56,57. Among the genes that are present in the QTL confidence interval, 188 showed significant cytoplasm × treatment interaction in these previous gene expression studies. In order to identify their association for cellular component we further tested for enrichment of GOs for these common genes that are present in QTL intervals and showed significant cytoplasm × treatment interaction in our previous gene expression studies (Supplementary Table S5). We found these genes to be significantly enriched with GO terms such as mitochondrial proton-transporting, ATP-synthesis complex, mitochondrial protein-complex and mitochondrial membrane.
Comments are closed.