

Secondary organic aerosol formation from mixed volatile organic compounds: Effect of RO2 chemistry and precursor concentration
SOA formation under different conditions
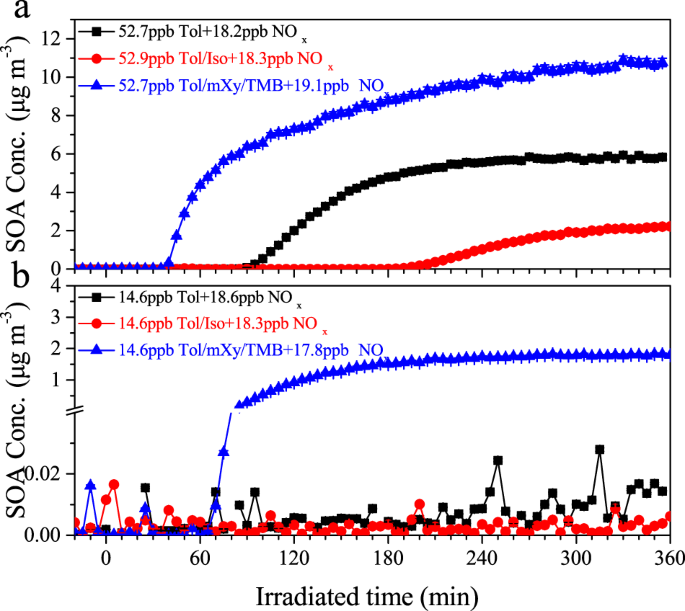
Under different mixed VOC scenarios (including individual AVOCs, mixed AVOCs and BVOCs, as well as mixed AVOCs), a series of photochemical experiments were conducted in the presence of NOx (~20 ppb). The detailed experimental conditions are summarized in Table 1. The HC0/NOx,0 ratio for those experiments had a wide range of 5.5–38.2 ppbC ppb−1, which covers the peak levels of heavy haze events occurred in China40. The temporal evolution of SOA concentrations formed from these photo-oxidation reaction systems is presented in Fig. 1. At higher VOC concentration levels (Fig. 1a), a considerable SOA concentration (Exp. Tol01, 5.8 ± 0.12 μg m−3) was formed in the toluene-only system, and the toluene SOA yield was calculated to be 4.8%, which is comparable to the results reported by previous studies16,17,41. However, this toluene SOA yield obtained in our present study was dramatically lower than those (~0.2–0.5) reported by Zhang et al.42, who conducted the experiments in the presence of high concentration of ammonium sulfate (AS) seed aerosols, which would greatly promote the gas-particle partitioning43. In the presence of isoprene (i.e., mixed AVOC/BVOC scenario, Exp. Tol/Iso02), SOA formation was greatly inhibited by up to 61.7%. This indicated the suppression effect of isoprene on SOA formation, and was consistent with previous studies25,26. In contrast, the highest SOA concentration of 10.8 ± 0.22 μg m−3, which was 85.6% higher than that in the toluene system, was observed with the coexistence with m-xylene and 1,3,5-trimethylbenzene (i.e., mixed AVOC scenario, Exp. Tol/mXy/TMB03). This may imply the enhancement of SOA formation by the coexistence of other AVOCs. Similar changes in SOA production were also found at lower VOC concentrations (Fig. 1b).
Table 1 Summary of experimental conditions in this study.Fig. 1: Time series of SOA concentrations.
SOA concentrations formed from photo-oxidation under different mixed VOC scenarios (i.e., toluene alone, mixed toluene and isoprene, as well as mixed toluene, m-xylene, and 1,3,5-trimethylbenzene) in the presence of NOx (~20 ppb) at a higher and b lower VOC concentration levels. The detailed experimental conditions can be found in Table 1.
To quantitatively evaluate the impact of coexisting VOCs on SOA formation, the toluene SOA yield was calculated after deducting the contribution of other reacted VOC precursors (i.e., isoprene, m-xylene and 1,3,5-trimethylbenzene) to SOA formation, which was determined by an additional series of experiments using individual VOCs (Details seen Supplementary Discussion). In the mixed AVOC/BVOC scenario (i.e., Exp. Tol/Iso02), the addition of isoprene significantly reduced the overall SOA yield and toluene SOA yield to 2.1 and 2.3% (Table 1), respectively, and the latter is 51.4% lower than that in the toluene-only system. In contrast, enhancement of the overall SOA yield and toluene SOA yield to 6.5 and 8.8% (Table 1), respectively were obtained in the mixed AVOC scenario (i.e., Exp. Tol/mXy/TMB03), and the latter was up to 83.9% higher than that in the toluene-only system. These results further suggested that coexisting VOCs indeed will negatively or positively affect SOA formation, depending on the class of VOCs (e.g., distinction between AVOCs and BVOCs). This is probably caused by the OH scavenging effect and changes in the oxidation pathways (e.g., related to RO2 chemistry).
Another notable effect observed in the systems with coexisting VOCs is the time at which SOA began to form (defined as the induction time). Taking the cases of higher VOC concentration as an example (Fig. 1a), the induction time became longer (170 min vs. 75 min) with the addition of BVOCs (i.e., Exp. Tol/Iso02), while it became shorter (30 min vs. 75 min) with the coexistence of other AVOCs (i.e., m-xylene and 1,3,5-trimethylbenzene, Exp. Tol/mXy/TMB03). This was closely related to the formation of gas-phase organic intermediates, thus affecting their contribution to SOA formation via gas-particle partitioning. Details will be discussed in the following section.
SOA formation and gas-phase organic intermediates
In our study, using an iodide HR-ToF-CIMS33, numerous gas-phase organic products with multiple oxygen- and nitrogen-containing organics could be well identified in the form of iodide-adducts. Figure 2 presents the gas phase mass spectra measured in different mixed VOC scenarios. It can be clearly observed that the intensity of intermediates with larger m/z (>120 Da) was greatly enhanced by the presence of other AVOCs, while being suppressed by the presence of isoprene. This effect is more pronounced in the range of m/z > 220 Da with a greater number of oxygen atoms (>7), as shown in the inset of Fig. 2. These differences suggested that the coexisting VOCs will affect the formation of these intermediates, and thus their contribution to SOA formation.
Fig. 2: Comparison of the gas-phase mass spectra.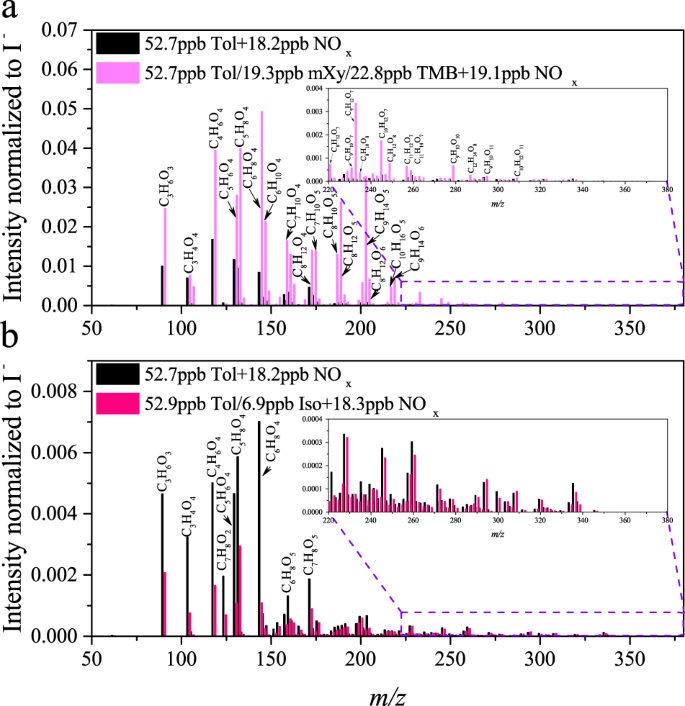
Gas-phase mass spectra derived from the photochemical experiments under different mixed VOC scenarios (i.e., toluene, mixed toluene and isoprene, as well as mixed toluene, m-xylene, and 1,3,5-trimethylbenzene) in the presence of NOx (~20 ppb) at higher VOC concentration levels. a toluene vs. mixed AVOC scenario and b toluene vs. mixed AVOC/BVOC scenario. Intensities were normalized to the ion source iodide. The assignments of detected ions to individual species were speculated considering iodide-CIMS has an inability to directly provide structural information.
These intermediate products are grouped into five classes based on their saturation vapor pressure (C*, Details can be seen Supplementary Method), i.e., volatile organic compounds (VOC), intermediate volatility organic compounds (IVOC), semivolatile organic compounds (SVOC), low volatility organic compounds (LVOC), and extremely low volatility organic compounds (ELVOC). Further, the quantitative contribution of these species to SOA formation was estimated based on their concentration and gas-particle partitioning coefficient (Details seen Supplementary Method), and the results are summarized in Fig. 3. On average, 27.7–39.2% of the SOA formation can be explained by the gas-particle partitioning of these intermediate products in different reaction systems, where the percentage is equal to the estimated SOA concentration divided by the measured SOA concentration. Similar contribution fractions were also reported by Wang et al.44, who indicated that 26–39% of the organic aerosol mass growth could be explained by the condensation of oxygenated organic molecules (OOMs). This highlights the urgent need to simultaneously obtain the organic gas- and particle-phase information at the molecular level to achieve better accuracy in SOA research.
Fig. 3: Time series of estimated SOA concentrations.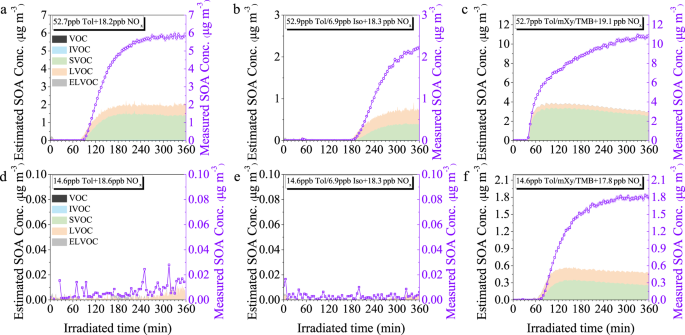
Estimated SOA concentrations derived from intermediate products (left y-axis) and measured SOA concentrations (right y-axis) under different mixed VOC scenarios (i.e., toluene, mixed toluene, and isoprene, as well as mixed toluene, m-xylene, and 1,3,5-trimethylbenzene) in the presence of NOx (~20 ppb) at a–c higher and d–f lower VOC concentration levels. The detailed experimental conditions can be found in Table 1.
Compared with the estimated SOA concentration derived from these intermediate products in the toluene-only scenario, the value became higher in the mixed AVOC scenario, while it was lower in the mixed AVOC/BVOC scenario with the addition of isoprene. These results were consistent with the trends of SOA concentrations formed in the three scenarios. Meanwhile, it can be found that the start time for the formation of these gas-phase species coincided with the induction time of SOA. These phenomena further suggested that the gas-particle partitioning of these low-volatility organic products was the dominant driving force in SOA formation45. Among the intermediate products, the contribution of ELVOC to SOA formation was relatively small, which was related to the moderate OH exposure (Table 1) used in our chamber study, as well as the insensitivity of iodide-CIMS to such species. Also, SVOC and LVOC were found to be the main contributors to SOA formation regardless of the reaction systems. However, their relative contribution to SOA was different in different reaction systems, which indicated that coexisting VOCs are involved in the formation of intermediate products, mainly through the reaction between RO2 formed from OH oxidation. The RO2 + RʹO2 reactions to form organic peroxide dimers (ROORʹ) was regarded as an important pathway for the formation of highly oxygenated organic molecules (HOMs), which play an important role in the formation and growth of SOA46,47,48,49.
In the mixed AVOC scenario with the coexistence of toluene, m-xylene, and 1,3,5-trimethylbenzene, in addition to the dimeric product C14H18O8 (Supplementary Fig. 1) from the self-reaction of bicyclic peroxy radicals (BPRs, one type of RO2, C7H9O5·) derived from toluene, more dimeric products (i.e., C16H22O8 and C18H26O8, Supplementary Fig. 1) from the self-reaction of BPRs (C8H11O5· and C9H13O5·) formed in the photo-oxidation of m-xylene and 1,3,5-trimethylbenzene, respectively were also generated, as well as dimeric products (e.g., C15H20O8 and C17H24O8, Supplementary Fig. 1) resulting from the cross-reaction of BPRs from different VOC precursors. Meanwhile, a number of dimeric products with odd oxygen numbers were detected (Fig. 2), which may be generated by the cross-reactions of RO2 with odd and even oxygen numbers from different VOC precursors35,50. For example, C9H14O5 shown in Fig. 2 can be attributed to the cross-reaction of CH3O2 radical and C8H11O5 radical, which are formed in the photo-oxidation of toluene and m-xylene, respectively. In addition, the cross-reaction of CH3O2 radical and C9H13O5 radical generated in the photo-oxidation of toluene and 1,3,5-trimethylbenzene, respectively, can form dimeric products with formula C10H16O5, as marked in Fig. 2. The intensities of the mass spectral signals for these organic peroxide dimers were significantly enhanced (Fig. 2), which will greatly promote the formation of SOA. In order to quantitatively evaluate the contribution of organic peroxide dimers derived from RO2 + RʹO2 reactions to SOA formation, all RO2 from the mechanism of the corresponding VOCs recorded in the Master Chemical Mechanism (MCM version 3.3.1, http://mcm.york.ac.uk/) were adopted, and a similar estimation method to that mentioned above was used. Their contributions are presented in Fig. 4, taking the cases of experiments carried out at higher VOC concentrations as an example. The observed evolution trends were similar to the trends in SOA concentrations formed in the three scenarios. Comparing Fig. 3 and Fig. 4, it can be concluded that the contribution of organic peroxide dimers to SOA can account for 39.9% in the toluene-only scenario (i.e., Exp. Tol01), while this contribution increased up to 64.4% in the mixed AVOC scenario with the coexistence of toluene, m-xylene, and 1,3,5-trimethylbenzene (i.e., Exp. Tol/mXy/TMB03). The contributions of organic peroxide dimers formed from the cross-reactions of RO2 from different VOCs and self-reactions of RO2 from the same VOCs were also examined, and the results showed that cross-reactions of RO2 generated from different AVOCs are the main contributors (up to 39.0%, Supplementary Fig. 2). These results suggested the importance of RO2 + RʹO2 reactions to SOA formation.
Fig. 4: Time series of the contribution of organic peroxides.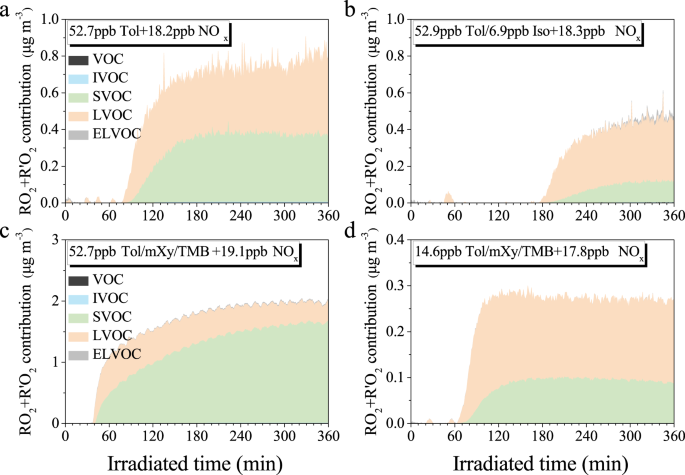
Contribution of organic peroxides derived from RO2 + RʹO2 under different mixed VOC scenarios (i.e., toluene, mixed toluene and isoprene, as well as mixed toluene, m-xylene, and 1,3,5-trimethylbenzene) in the presence of NOx (~20 ppb) at a–c higher and d lower VOC concentration levels. The detailed experimental conditions can be found in Table 1.
In the mixed AVOC/BVOC scenario with the addition of isoprene (i.e., Exp. Tol/Iso02), although the contribution of organic peroxide dimers to SOA also increased to 64.4%, the formation of gas-phase organic intermediates was significantly suppressed due to the relatively lower OH concentration (reduced by about 50%, Supplementary Fig. 3) by the OH scavenging effect of isoprene25, resulting in less SOA formation compared to the toluene-only scenario. The most intuitively persuasive evidence is that the intensities of mass spectra signals became weaker with the addition of isoprene than those in the individual toluene scenario, especially for C3H6O3, C3H4O4, C4H6O4, C7H8O2, C5H6O4, C5H8O4, C6H8O4, C6H8O5, and C7H8O5, as marked in Fig. 2. These species correspond to products from the reaction of toluene with OH contained in the near-explicit gas phase Master Chemical Mechanism (MCM version 3.3.1, http://mcm.york.ac.uk/)51. The volatility distributions of the gas-phase organic intermediates under different mixed VOC scenarios further supported this conclusion, where the relative intensity of these species (especially for SVOC, LVOC, and ELVOC) became significantly weaker in the mixed AVOC and BVOC scenario with the addition of isoprene (Supplementary Fig. 4).
Effect of precursor concentration on SOA formation
In this study, the formation of gas-phase organic intermediates (i.e., VOC, IVOC, SVOC, LVOC, and ELVOC) under different VOC concentration levels was also compared to reveal the effect of precursor concentration. In the toluene-only system (Fig. 5a), the normalized contributions of SVOC, LVOC and ELVOC, which are more oxidized with lower volatility, were greater at lower precursor concentrations, while the less-oxidized VOC and IVOC category showed the opposite trend. This indicated that VOC precursor concentrations will affect the oxidation process, and thus the volatility distributions of gas-phase products. According to the chemistry of toluene degradation in the Master Chemical Mechanism (MCM version 3.3.1, http://mcm.york.ac.uk/), the rate constant for the reaction of toluene + OH (ktoluene+OH = 5.63 × 10⁻¹² cm3 molecule−1 s−1) is lower than those for the reactions of subsequent products with OH or HO2 (e.g., kcresol+OH = 4.65 × 10⁻¹¹ cm3 molecule−1 s−1, and kBPRs+HO2 = 1.87 × 10⁻¹¹ cm3 molecule−1 s−1). Thus, there was a clear competition between the reactions of toluene and the formed intermediates with OH, and the reaction of the intermediates with OH was dominant. As a result, the proportion of toluene consumed will be lower (42.5% vs. 57.2% for Exp. Tol04 and Exp. Tol01, respectively) and the proportion of more-oxidized intermediates formed will be larger at lower toluene concentration levels, as supported by the greater normalized contributions of SVOC, LVOC and ELVOC mentioned above. This further resulted in a higher oxidation state (OSc = 2 × O/C − H/C, 0.55 ± 0.02 vs. 0.41 ± 0.01) for SOA formed at lower toluene concentration, for which H/C and O/C were derived from the elemental analysis of HR-ToF-AMS data52. Similar results were also observed in the mixed AVOC/BVOC scenario (Fig. 5b). It is worth noting that the effect of precursor concentration was attenuated by the addition of isoprene, as evidenced by the reduction in the gap in the normalized contributions of different VOC categories compared with those in the toluene-only scenario between high- and low-precursor conditions. This was related to the OH scavenging effect of isoprene25, which will reduce the OH concentration in these reaction systems (Supplementary Fig. 3).
Fig. 5: Normalized contributions of different classes of gas-phase organic intermediates.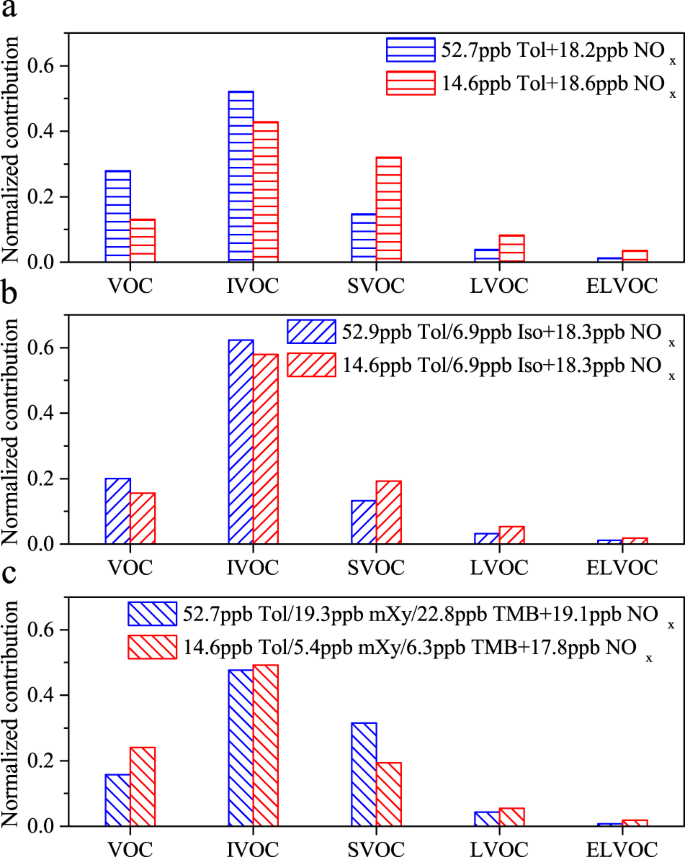
Contributions of different classes of gas-phase organic intermediates (i.e., VOC, IVOC, SVOC, LVOC, and ELVOC) formed from photo-oxidation under different mixed VOC scenarios in the presence of NOx (~20 ppb) at higher and lower VOC concentration levels. a toluene, b mixed toluene and isoprene, as well as c mixed toluene, m-xylene, and 1,3,5-trimethylbenzene.
In the mixed AVOC scenario (Fig. 5c), larger normalized contributions of LVOC and ELVOC were also observed at lower precursor concentrations. This was consistent with those in the toluene-only scenario, as well as the mixed AVOC/BVOC scenario. However, the contributions of SVOCs were larger at higher precursor concentrations compared to those at lower precursor concentrations. This was related to the contribution of RO2 + RʹO2 reactions to SOA formation. Comparing Fig. 4c and Fig. 4d, it can be found that a large proportion (up to 81.8%) of SVOC was generated from the RO2 + RʹO2 reactions at higher precursor concentrations, while LVOC became the dominant fraction (up to 66.3%) at lower precursor concentrations. This is partly related to the higher concentration of precursors, but also to the concentration levels of OH in both systems. Under lower precursor concentration conditions, the estimated OH concentration was higher ([OH] = 9.41 × 10⁶ molecule cm−3 vs. 4.28 × 10⁶ molecule cm−3, Supplementary Fig. 3) and a larger proportion of precursors (e.g., the consumption proportion of toluene was 63.6% vs. 36.3% for Exp. Tol/mXy/TMB06 and Exp. Tol/mXy/TMB03, respectively) was consumed. These will collectively result in higher contributions from the VOC and IVOC categories at lower precursor concentration conditions, as shown in Fig. 5c. Meanwhile, a higher OSc (0.17 ± 0.06 vs. −0.19 ± 0.02) was also observed for SOA formed at lower precursor concentrations. Additionally, it is worth noting that a larger toluene SOA yield (3.7% at Mo = 1.8 μg m−3, Table 1) was observed in the mixed AVOC scenario with lower precursor concentrations. Compared to the SOA yields obtained at higher precursor concentrations (Table 1), this SOA yield observed at lower precursor concentrations was significantly different from (t-test, p < 0.05) and greatly higher (1.9 times) than that predicted from the yield curve obtained at higher concentrations (Supplementary Fig. 5). This suggested that the formation and partitioning of low-volatility intermediates (e.g., SVOC, LVOC, and ELVOC) play a crucial role in the oxidation state of SOA, as well as the SOA yield.
Comments are closed.