

The influence of self-cycling fermentation long- and short-cycle schemes on Saccharomyces cerevisiae and Escherichia coli
Improved productivity in SCF
In S. cerevisiae cultures undergoing SCF operation, long- and short-cycle operation led to similar yields but the latter led to a 1.6-fold increase in volumetric productivity (Table 1). On the other hand, in E. coli cultures, the short-cycle operation led to increases in both yield and productivity, by 1.8-fold and 2.7-fold, respectively (Table 1). In a previous study investigating E. coli ATCC 11303 growing in SCF long cycles5, the yield was found to be 0.23 L/g glucose, and the biomass productivity was 0.28 h−1 (Table 1). It was also noted that the average glucose consumption rate and mean CER per cycle were enhanced during short-cycle operation for both S. cerevisiae and E. coli, despite lower cell density (Figs. 1, 3 and Supplementary Figs. S2, S4)—indicating more glucose consumed and CO2 released per cell in short cycles. That is to say, cellular activity was generally more intense during SCF short cycles.
Significant improvements in productivity and metabolic activity highlight the advantages of the SCF short-cycle scheme over its long-cycle counterpart; however, both approaches have benefits over BR. In fact, increased productivity (compared to BR) has been shown in many long-cycle SCF experiments, including production of ethanol and shikimic acid using S. cerevisiae3,4,8,23 and production of bacteriophage and recombinant protein using E. coli1,2. It is likely that productivity could be further improved upon implementation of short-cycle SCF schemes.
Cell replication during SCF long and short cycles
Multiple SCF studies have shown a link between the occurrence of an optimum in DO or CER and the completion of synchronized cell division7. In order for SCF operation to be stable, since it relies on the replacement of one half of the reactor content, the cell population must double (one generation) every cycle. If cells did not complete one round of cell replication per cycle, washout would occur, resulting in instability. Since the short-cycle operation was stable and repeatable in S. cerevisiae and E. coli cultures (Figs. 1d, 3c and Supplementary Figs. S1, S2, S4), we can infer that cell division was complete each cycle by the time CER reached a maximum. Step-wise cell count doubling, ending co-currently with a maximum in CER, was observed in previous SCF studies using long cycles with S. cerevisiae (the same strain as in the current study)3,23 and E. coli (ATCC 113035 and CY150502). This suggested that cell replication was indeed synchronized. Thirdly, prior work with S. cerevisiae showed significant up-regulation of genes related to DNA replication and of selected cyclin genes (CLN1, CLN2, CLB3, CLB1, and CLB2) in the first half of long SCF cycles23. This suggests little to no replication activity took place after the maximum in CER was reached.
The expression profiles of cyclin genes in S. cerevisiae undergoing short SCF cycle (Fig. 2) provide evidence of at least some level of cell synchrony. It is interesting to note that, compared to expression of the same genes in the same strain undergoing long SCF cycles23, the amplitude of the differential expression observed was smaller during short cycles (Fig. 2b). This was likely due to the incomplete utilization of glucose, resulting in a tamer entrainment effect (an effect leading to the periodic availability of essential nutrients inducing synchronization21) during short cycles. Secondly, the sequence of cyclin genes expression suggested that the cell replication of partially synchronized populations started from the middle of the short cycles and was completed at the same point in the subsequent cycle (with cell division occurring over a shorter period). CLN1 and CLN2 were expressed later than CLB1 and CLB2 during SCF short cycles (Fig. 2b)—an inverse sequence compared to the standard yeast cell cycle27,28 and to the sequence observed in long SCF cycles23. This unexpected, distinct, cycle-spanning cell replication pattern in short-cycle SCF operation could have been caused by forces other than the oscillation of glucose concentration, as the nutrient cycle itself is expected to lead to an alignment between the start of SCF cycles and that of the cell cycle23.
It appears that yeast cell replication did not present the same intra-cycle pattern during long SCF cycles. For one, as mentioned above, there was no substantial expression of the selected cyclin genes during the second half of the long cycles23, suggesting little to no replication activity over that period. Moreover, the onsets of long SCF cycles and of the yeast cell cycle were aligned, as suggested by the sequential expression of the cyclin genes during the first half of long cycles (consistent with the standard yeast cell cycle; CLN1 and CLN2 expressed earlier than CLB1 and CLB2)23. Furthermore, the cycle time of long cycles was more than twice the doubling time of S. cerevisiae in the same nutrient conditions.
Continuous operation with limited carbon feeding after starvation resulted in robust oscillations in the profiles of DO, transcriptomics, and metabolomics, suggesting mechanisms encompassing the cell and metabolic cycles29,30,31. While SCF operation does not involve significant nutrient limitation, previous transcriptomic work also demonstrated significant changes in regulatory patterns during each SCF cycle23. For instance, towards the end of S. cerevisiae long cycles, the citrate cycle, oxidative phosphorylation, and gluconeogenesis pathways were highly up-regulated. Future work will be allocated on measuring more metabolic patterns during SCF cycles and comparing SCF operation with carbon-limited continuous operation.
Three trends in SCF
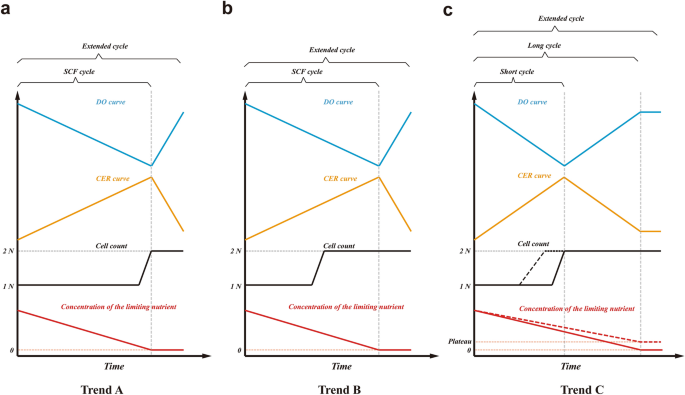
When surveying SCF studies, three different trends, based on significant differences in the occurrence of key events, take shape. These key events are (1) the time of the optimum in the control parameter (e.g., DO minimum, CER maximum or ORP inflection point), (2) the time of completion of synchronized cell division, and (3) the depletion or plateau of the limiting nutrient. The three trends based on these events are summarized in Fig. 4.
Figure 4
Schematic of the conceptual trends in characteristic events during SCF. DO curve (for aerobic conditions) is shown in blue, CER curve (for aerobic or anaerobic conditions) in orange, cell count in black, and concentration of the limiting nutrient in red. Straight lines are used to describe general trends. (a) Trend A: Optimum in control parameter (DO minimum or CER maximum), the end of synchronized division, and the depletion of the limiting nutrient co-occur at the end of the SCF cycle. An extended cycle allows for a delay in cycling. (b) Trend B: Optimum in control parameter (DO minimum or CER maximum) and the depletion of the limiting nutrient co-occur at the end of the SCF cycle, but synchronized cell division ends in the middle of the cycle. An extended cycle allows for a delay in cycling. (c) Trend C: DO or CER plateaus as limiting nutrient becomes depleted (or reaches its own plateau, the red dashed line) at the end of the SCF long cycle, but synchronized cell division ends in the middle of the long cycle (corresponding to an optimum in DO or CER). In trend C, an SCF short cycle can be implemented when cycling is done at the time of the optimum in control parameters but partially synchronized cell replication (the black dashed line) starts and ends in the middle of the short cycle. The limiting nutrient is not depleted by the end of the short cycle. An extended cycle allows for a delay in cycling beyond the end of a long cycle.
Nitrogen or carbon sources are frequently set as the limiting nutrients dictating the cycling of SCF operation. Control parameters used to establish cycling conditions have included DO, CER, and ORP7. Mass flow rate of the exit gas has also been used for SCF of S. cerevisiae Superstart™ producing ethanol8 and was a direct reflection of CER under anaerobic conditions. In studies of Pseudomonas putida ATCC 12633 degrading phenol12 and Acinetobacter calcoaceticus RAG-1 ATCC 31012 grown on hexadecane32, CER patterns were found to mirror DO patterns, and the CER maximum aligned with the DO minimum. Under aerobic conditions, the relationship between CER and DO generally holds, with exceptions. However, ORP patterns during SCF operation are generally more complex than other parameters. For example, ORP increased for P. putida ATCC 12633 degrading toluene16, but decreased when Pseudomonas denitrificans ATCC 13867 was used for the removal of oxidized nitrogen15. The presence and absence of oxygen in these two studies were likely responsible for these diverging patterns. Overall, during SCF operation, the minimum in DO coincides with the maximum in CER (under aerobic conditions), and the ORP inflection point occurs near this point15,16.
Many early SCF studies exhibited Trend A (Fig. 4a), in which the depletion of the limiting nutrient coincided with the characteristic point in the control parameter (OD, CER or ORP) and with the completion of synchronized cell division. SCF cycling was triggered upon this concurrence unless an extended cycle strategy was applied. The first implementation of SCF, for B. subtilis ATCC 21332, showed the minimum in DO corresponded with the depletion of the nitrogen source and the end of OD doubling18. The end of synchronized cell doubling (a step-wise increase in cell count) co-occurred with nitrogen source exhaustion and with a minimum in DO when SCF was used to produce sophorolipids by Candida bombicola ATCC 2221424 and citric acid by Candida lipolytica ATCC 2039010. The same pattern was observed for A. calcoaceticus RAG-1 ATCC 31012 grown on ethanol6 and for P. putida ATCC 12633 degrading aromatic compounds13. Similarly, when P. denitrificans ATCC 13867 was used to degrade oxidized nitrogen sources in SCF, the end of cell dry weight doubling corresponded to the inflection point in ORP and to nitrogen depletion15.
To that point, the reliability of Trend A (Fig. 4a) had been considered universal. For example, in studies tackling hydrocarbon degradation using A. calcoaceticus RAG-1 ATCC 31012 and cultivating B. subtilis ATCC 21332, the authors directly took the equivalence of SCF cycle time and cell doubling time as a default14,17. However, this was only true when synchronized cell division was terminated upon the initiation of SCF cycling6,10,13,24. It should also be noted that the end point of the doubling of OD or dry weight does not necessarily represent the end of cell doubling. These can be decoupled and display different trends, especially in synchronized populations for which the cell count increases in a step-wise manner, while OD and dry weight display continuous, near-linear increases2,33.
However, when growing Alcaligenes eutrophus DSM 545 producing polyhydroxybutyrate (PHB) and growing B. subtilis ATCC 10774 under SCF operation, synchronized cell division was completed much earlier—in the middle of the SCF cycles—than the concomitant minimum in DO and depletion of nitrogen sources33,34. These SCF cultures are representative of Trend B (Fig. 4b).
Compared to Trends A and B, the scenario observed in a study investigating biosurfactant production using Corynebacterium alkanolyticum ATCC 21511 growing on hexadecane in SCF was substantially different35. The minimum in DO and the completion of synchronized cell division occurred concomitantly, but a considerable amount of carbon source remained. Similarly, recent SCF work using engineered S. cerevisiae CEN.PK 113-1A Matα, E. coli ATCC 11303 and E. coli CY15050 depicted an identical trend—cell count doubled step-wise at the maximum in CER (at the cycle midpoint), but glucose, the limiting nutrient, was only exhausted once the decrease in CER flattened (at the end of the cycles)2,3,5,23. In ethanol production using S. cerevisiae Superstart™ undergoing anaerobic SCF, glucose was depleted upon the time the exit gas mass flow rate (a proxy for CER) decreased and stabilized, though cell counts were not reported due to clumping of the yeast cells8. As mentioned earlier, the same trend was also observed in the present study when cultivating engineered S. cerevisiae CEN.PK 113-1A Matα or E. coli MG1655 (with glucose reaching a plateau when the latter underwent long-cycle SCF). Transcriptional evidence during S. cerevisiae SCF short cycles (Fig. 2b) revealed a likely cell replication pattern under this operation scheme: a partially synchronized cell cycle starting and ending in the middle of short cycles. All these studies are representative of Trend C (Fig. 4c).
The discrepancies amongst the three major trends were likely derived from intrinsic differences in the microorganisms and nutrient environments used. A. eutrophus and B. subtilis ATCC 10774 (following Trend B), and C. alkanolyticum, E. coli and S. cerevisiae (following Trend C) likely sensed nutrient conditions more actively and adopted a feed-forward strategy—in which cells proactively sensed external changes and regulated gene transcription and expression prior to the alteration of the growth rate36. From a growth strategy perspective, it seems these synchronized cultures completed one cell cycle but did not continue the proliferation at the expense of the remaining limiting nutrient (Fig. 4b,c). On the contrary, for a number of microorganisms following Trend A, all the available limiting nutrient was used in completing cell doubling (Fig. 4a). The difference between A. eutrophus and B. subtilis ATCC 10774 in Trend B, and C. alkanolyticum, E. coli and S. cerevisiae in Trend C is expected to lie in the respiratory intensity between the end of the cell cycle and the time at which the limiting nutrient was depleted or reached a plateau. For the Trend B microbes, the intensity of respiration increased even after synchronized cell replication. Therefore, the optimum in the control parameter (DO minimum) co-occurred with the exhaustion of the limiting nutrient but not with the end of cell doubling (Fig. 4b). For microbes displaying Trend C, respiration slowed significantly after synchronized cell replication (during the consumption of the residual limiting nutrient), and therefore CER maximum or DO minimum occurred at the completion of synchronized cell doubling but not at the depletion or plateau of the limiting nutrient (Fig. 4c).
Physiological differences in strategies for nutrient use, proliferation, and respiratory intensity are hence revealed during SCF operation, suggesting that this method could be helpful in studying cell physiology. It is also noted that synchrony helps with these explorations: trends reflected by synchronous populations would be more reflective of intrinsic physiological properties.
Different nutrient conditions may lead to different physiological responses and affect SCF trends. For example, the use of different limiting nutrients—nitrogen- or carbon-sources—in a continuous phased culture tremendously affected the time of completion of synchronized cell replication of Candida utilis Y-900 when the cycle time was set to 4, 6, 8, and 12 h37. Further studies on this topic could lead to more in-depth understanding of the physiological patterns during SCF.
A novel definition of SCF
Limiting nutrient depletion has been one of the original premises of SCF, but a broader picture is emerging. Trend C, observed in a growing number of studies, suggests a deviation from the original description of SCF–it does not necessarily require limiting nutrient depletion. Consequently, a novel definition of SCF is proposed below, taking into consideration all the scenarios presented in Fig. 4. This new SCF definition excludes the requirements of limiting nutrient depletion and joint occurrence of all three key events.
SCF is a semi-continuous fermentation approach that allows the completion of one generation of microbial cell replication during each cycle. The cycling procedure comprises harvesting precisely one half of the working volume and then replenishing with the equivalent amount of fresh medium. Automated cycling is dictated by microbial growth and metabolic activity and is triggered based on monitoring one or more growth- and/or metabolism-associated parameters (e.g., DO, CER, ORP, exit gas mass flow rate, etc.). SCF cycling takes place directly after the completion of one generation of cell proliferation or with a delay, depending on the microorganism, the initial nutrient conditions, and the conditions for cycling being implemented. SCF cycling is not necessarily related to the time at which the limiting nutrient is depleted or reaches a plateau. If limiting nutrient depletion or a plateau does not co-occur with the cell cycle completion, we identify SCF operation that cycles in advance of exhaustion or a plateau of the limiting nutrient as “short cycle”; and correspondingly, SCF operation that cycles upon depletion or a plateau of the limiting nutrient as “long cycle” (Fig. 4). “Extended cycle” is generally referred to as SCF operation that cycles beyond exhaustion or a plateau of the limiting nutrient.
Comments are closed.